So great, we are planning to all this receiving LNG infrastructure but what is the distribution of this resource in the world. What countries are we getting in bed with next.?
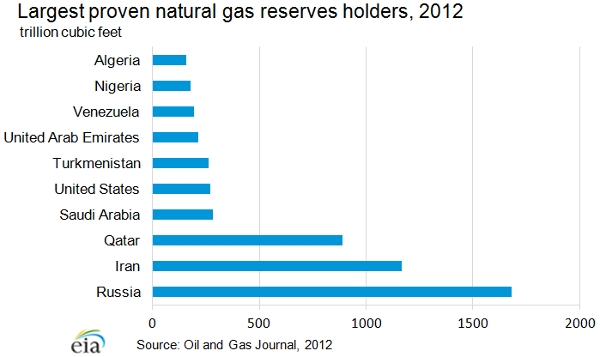
So, Who's got the Gas? Clearly there are only two regions that matter.
Note The Strategic Ellipse
World proved natural gas reserves at end-2013 stood at 185.7 trillion cubic metres (tcm), sufficient to meet 55.1 years (BFD) of global production. Proved reserves grew by 0.2% relative to end-2012 data
Stated quite simply, the US build out of LNG infrastructure will demand reliable "partnerships" with Russia and Iran. None of this seems very sensible.
Current Data:
compare this to the 2006 picture:
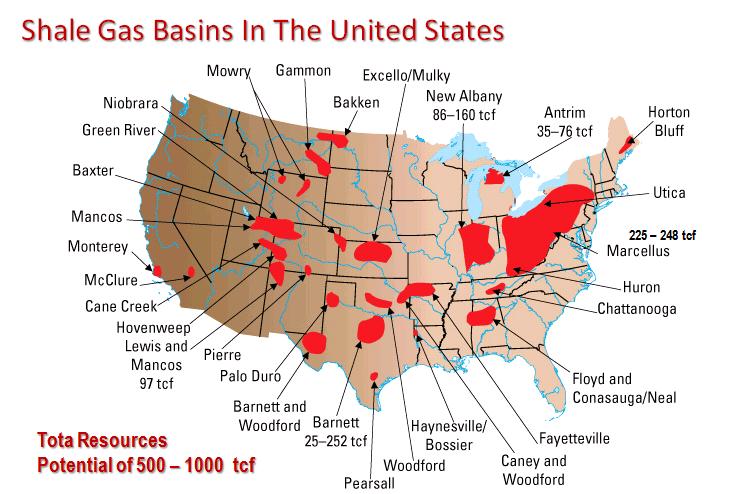
The map below shows known (many of which recently discovered) shale-gas basins in the US. These reserves can not be accessed with conventional drilling technologies for
a variety of reasons. Most companies plan to harvest the resource by using
horizontal or slant drilling techniques that ultimately involve fracking (see next lecture):
Drill Baby Drill
Detailed Animation
about how horizontal drilling works Pay attention to this and think about
all the possible failure points in this process along with sheer amount of concrete and steel that is necesesary, per well head.
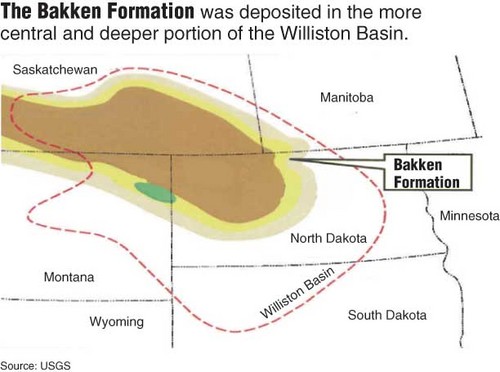
In addition to the shale gas Boom/Bust currently happening in Pennsylvania, the newly discovered Bakken Formation in North
Dakota (extending into Canada) is now the subject of fairly intense commercial interests.
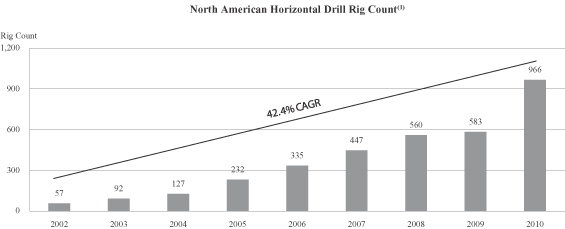
Fossil Yields in the Bakken formation:
and corresponding growth in production
Using a geology-based assessment methodology, the U.S. Geological Survey
estimated mean undiscovered volumes of 3.65 billion barrels of oil, 1.85 trillion cubic
feet of associated/dissolved natural gas, and 148 million barrels of natural gas liquids
in the Bakken Shale Formation of the Williston Basin Province, Montana and North Dakota.
But what do these discovery numbers mean in the context of our consumption?
Annual Consumption of NG in the US is now at 22 TCF  1.85 TCF is .08 years worth. Note that
some recent industry estimates suggest that the USGS is wrong by more than a factor around
100 and say that 165 TCF is available BFD: that's still only 8 years worth. 1.85 TCF is .08 years worth. Note that
some recent industry estimates suggest that the USGS is wrong by more than a factor around
100 and say that 165 TCF is available BFD: that's still only 8 years worth.
US uses 21 MBD of oil. So in 47 days the US uses 1 Billion Barrels of Oil. Do we care
that there are 3.65 Billion Barrels (about 6 monnts worth) in the Bakken Formation?
And this just in ...
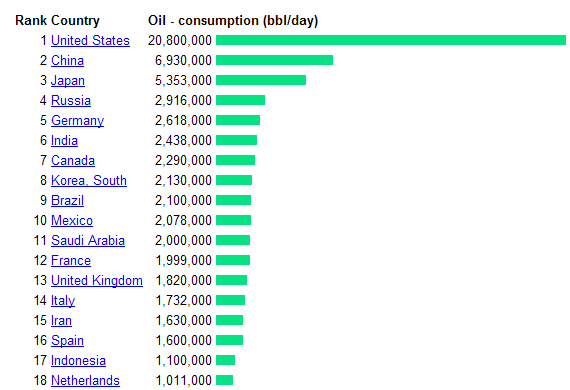
Bottom Line: Like the short sighted numbskulls that we are - we will likely try to fully exploit
the very small Bakken resource instead of consuming less or investing more in renewable energy implementation. As shown in the figure below, the US clearly leads the world in oil consumption and this is a general proxy for how over consumptive the US is compared to the rest of the world. I believe this
is called
American Exceptionalism
Worldwide Potential:
- World natural gas reserves are abundant, estimated at about 5,500 trillion cubic feet (Tcf), or 60 times the volume of natural gas used in 2003.
- Much of this gas is considered stranded because it is located in regions distant from consuming markets. therefore large scale
infrastructure projects are needed. Note the dramatic imbalance for the US.
Clearly if LNG is our future energy plan, then large scale importation is
mandatory.
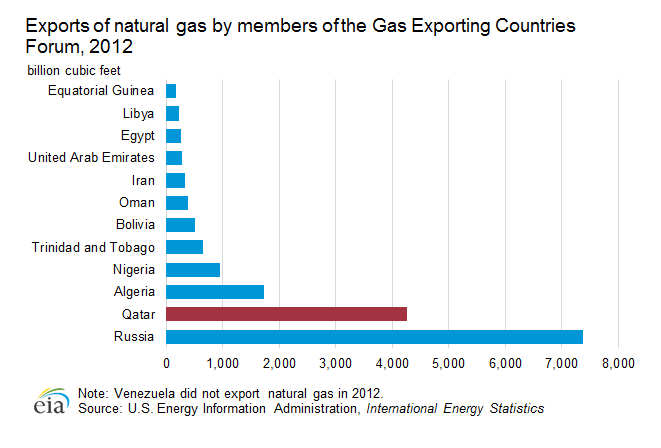
- Russia, Iran, and Qatar combined hold natural gas reserves representing more than 50 percent of the world total. As a result, Russia will invest
heavily in infrastructure to become a major player in the emerging energy
market in India and China as well as the European Union.
This has major energy policy implications for the EU and certainly will
increase there dependence on Russia and Russian Natural Gas.
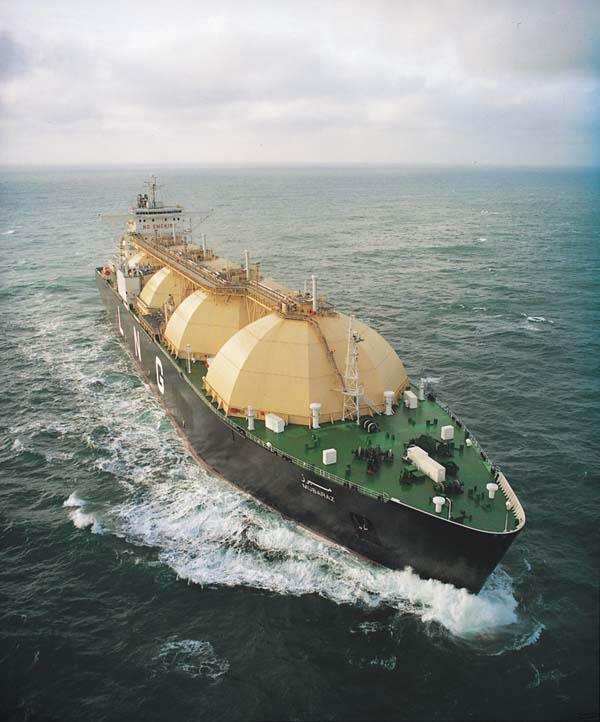
Tankers versus Pipelines:
Economic Crossover point: At what point does it become cheaper to
transport Natural Gas in Liquified form via an ocean tanker compared to
a pipeline.
- Industry analysis suggests this cross over is 2000-3000 kilometers
of on/off shore pipeline. In otherwords, its cheaper to ship it across
10,000 km of open ocean, than it is through more than 3000 km of pipeline. This then drives the LNG (truly large) tanker/importation facility
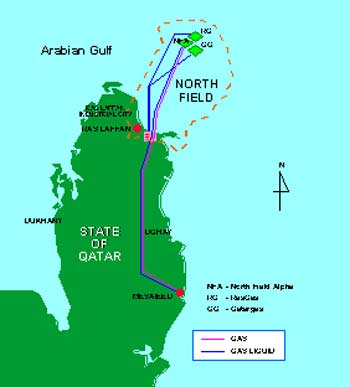
infrastructure and various country plans to develop these pathways with the country Qatar being furthest along.
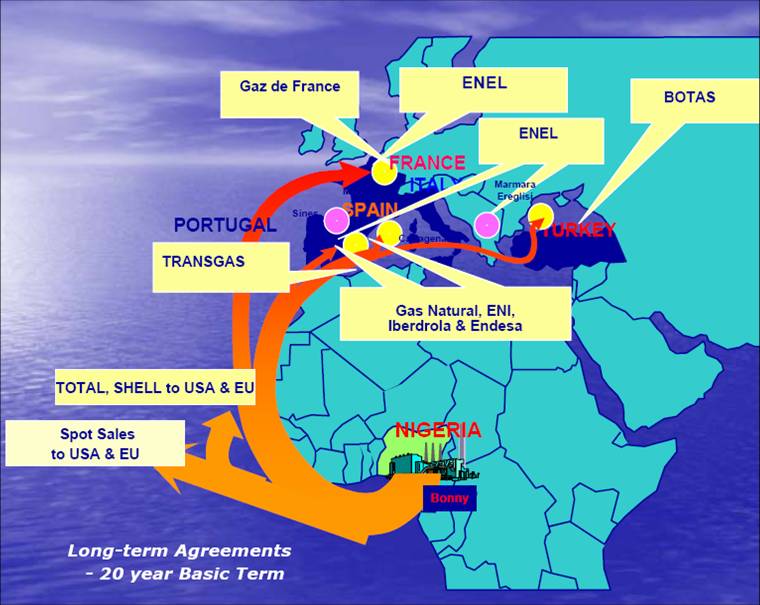
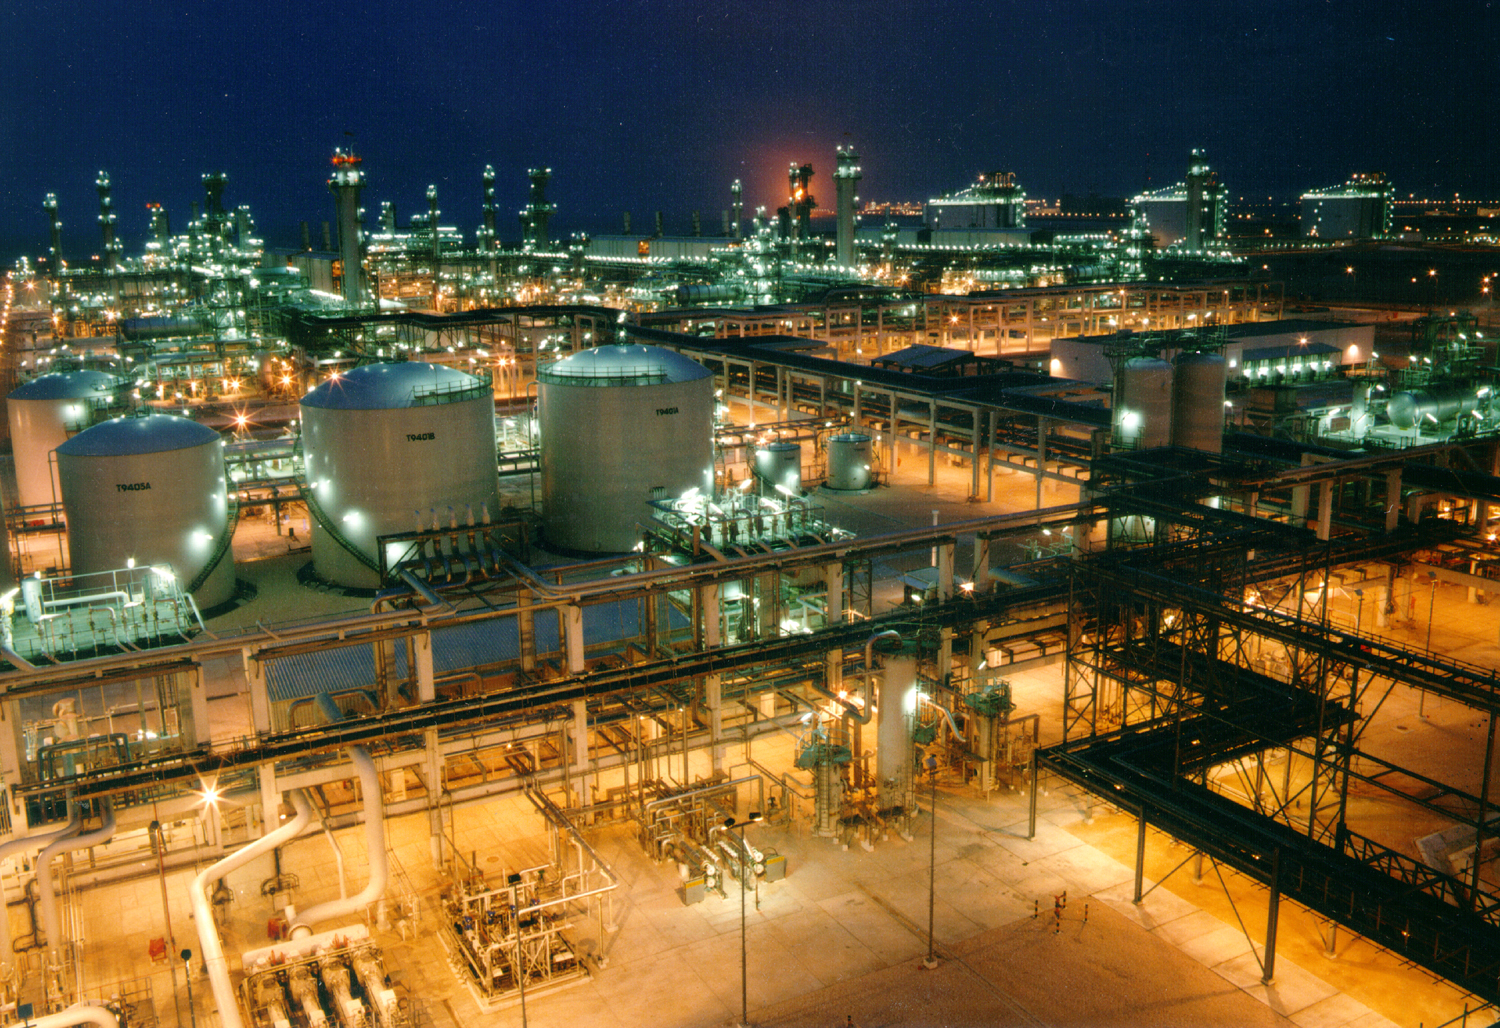
Qatar
The US Context:
In 1993 natural gas was used to generate 9% of the electrical power consumed in the United States.
In 2003 that figure was 18%. But look now:
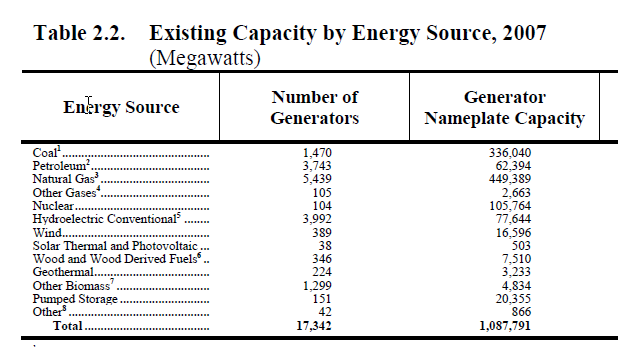
Nameplate capacity of NG exceeds coal!
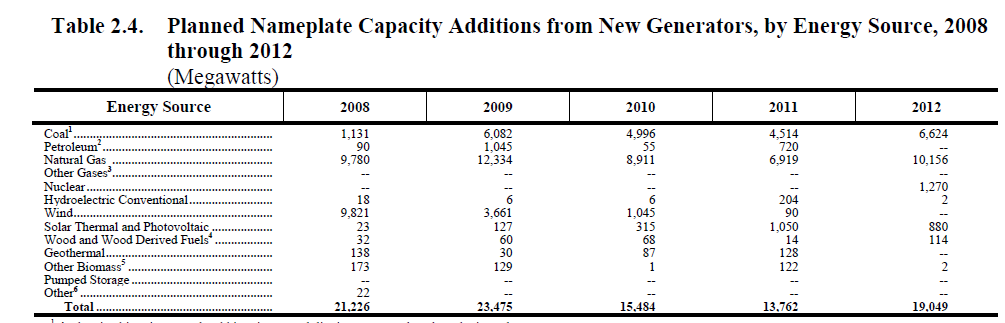
Planned capacity additions are heavily weighted towards NG
This is our Energy Trajectory!
Natural Gas as Electricity (heat water) is only somewhat cleaner
than coal-fired electricity:
Emissions:
1135 lbs of CO2 per MWh 1/2 as much
from Coal.
0.1 lbs of SO2 per MWh 1% that of Coal.
1.7 lbs of NOx per MWh 1/3 that of Coal.
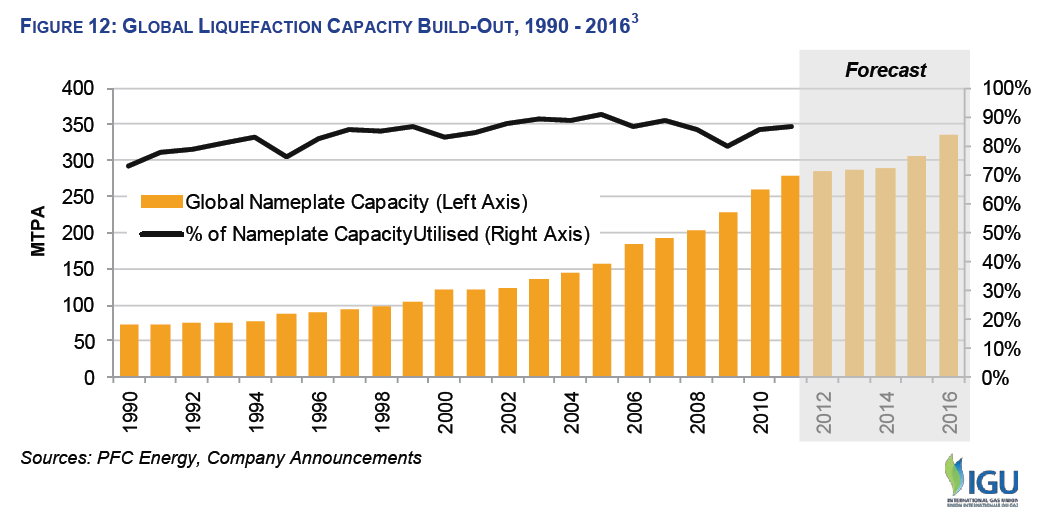
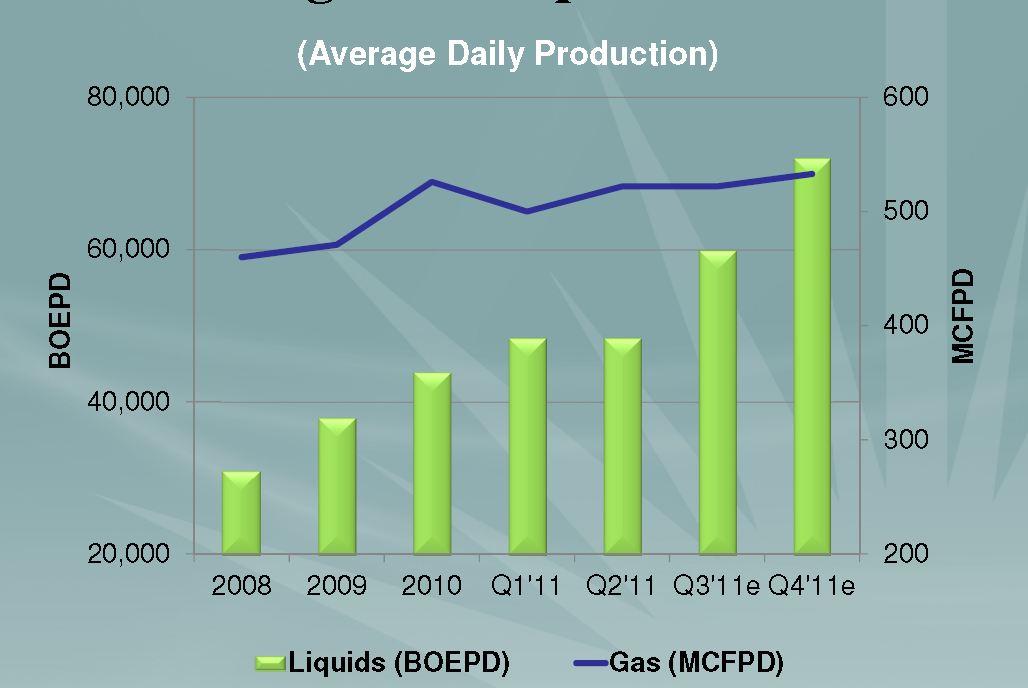
Demand is clearly rising, both in the US and elsewhere:
To feed the increasing demand, liquefied natural gas (LNG) terminals are being proposed, to enable imports for the remaining natural gas, now that oil production has started peaking globally.
Natural gas is expected to peak globally around 2020, which could lead to serious global conflict as China and other large and growing economies continue down the path of increased dependance on fossil fuels.
The U.S. has 4 existing LNG terminals and at least 46 additional
LNG terminals are proposed, though some have estimated that only 6-8 are needed to meet demand.
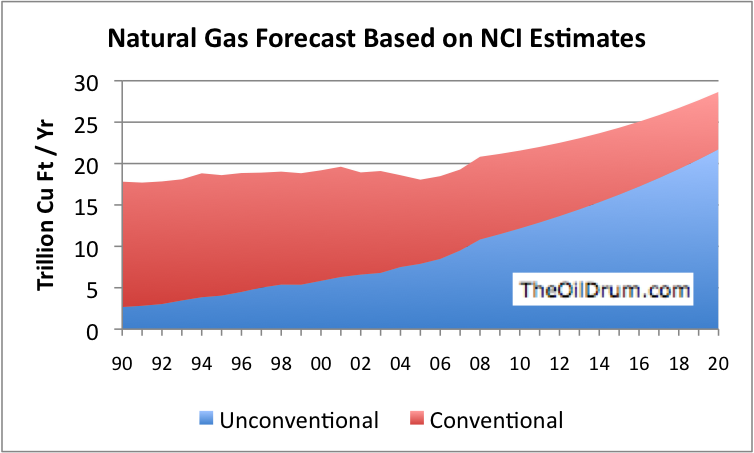
Projections and Figures
- From 1990 to 2004 Natural Gas consumption increased by 16%
(or about 1% per year) and is expected to continue to rise at least
at this rate in the near future.
- Natural Gas Production in the US is currently 19.0 -- 19.5 TCF
- Current Natural gas annual consumption is 21-22 TCF per year (variation
driven by winter time heating season).
- Current NG fired electricity is about 20% of total mix (50% is
coal) but that is expected rise in the near future
- Net imports from Canada are projected to decline from 3 TCF (2005)
to 2.5 TCF in 2009 (they may rise again, if Canada invests in more production).
- Increased US production will rely heavily on tapping unconvential soures of NG (this
will be expensive and technologically difficult).
- New pipelines are needed. Therefore if large scale pipelines are stopped the supply
chain has been crippled and we might be forced to other alternatives. In general,
What ever the case, demand is forecast to rise and within that demand state, this is what we know:
- Canada Reserves stand at 58 TCF 3 years of US Demand
- Venezuala stands at 152 7 years of demand so strong potential source
of short term LNG imports.
- Russia stands at 1680 TCF! (but little of that is developed, yet) Nonetheless, it well be developed and the US wants it all ...
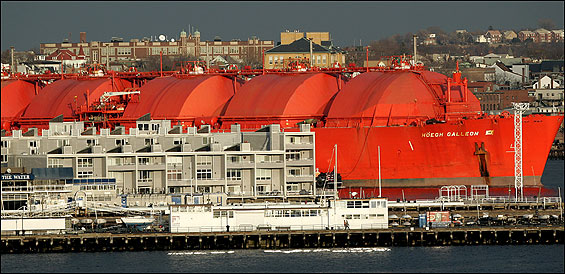
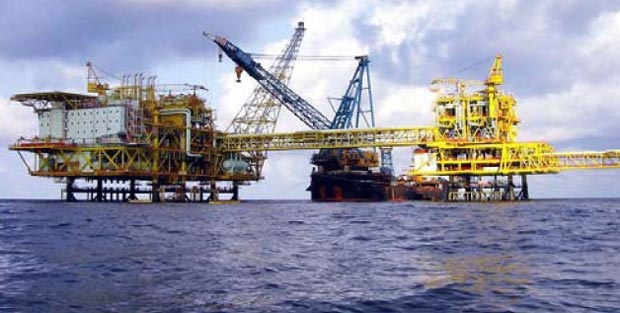
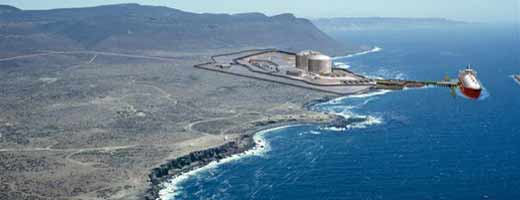
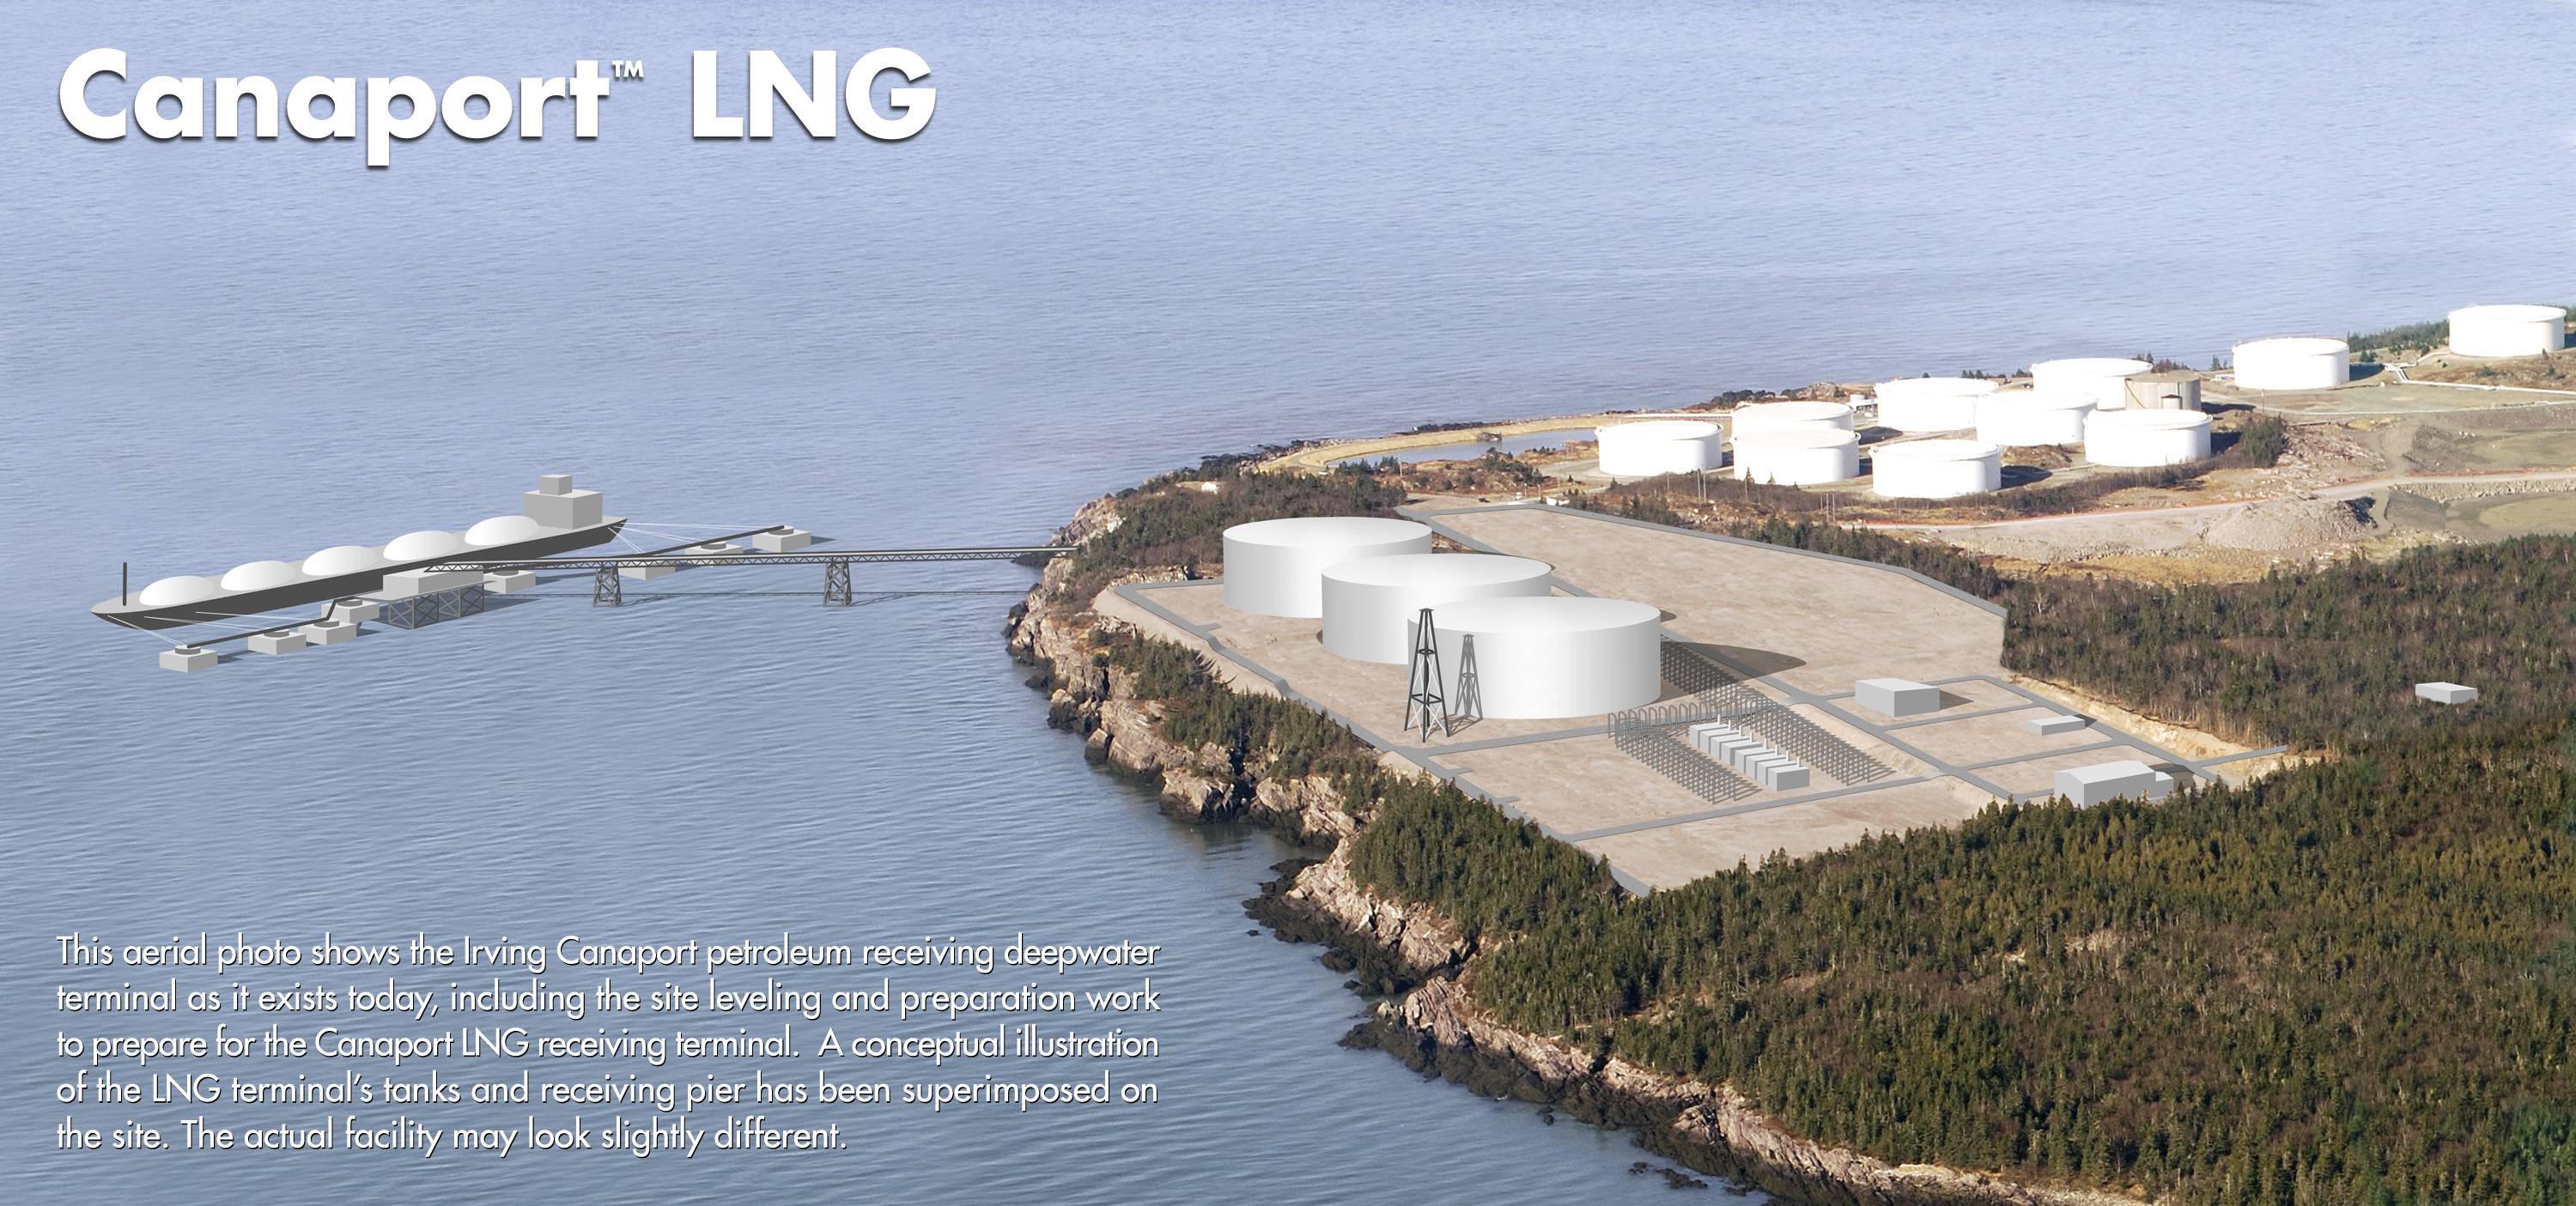
- LNG imports are expected to reach at least 7 TCF by 2025 so
we plan to build these kinds of facilities:
Artist Conception of LNG facility in Baja
A real one in Canada nearing completion:
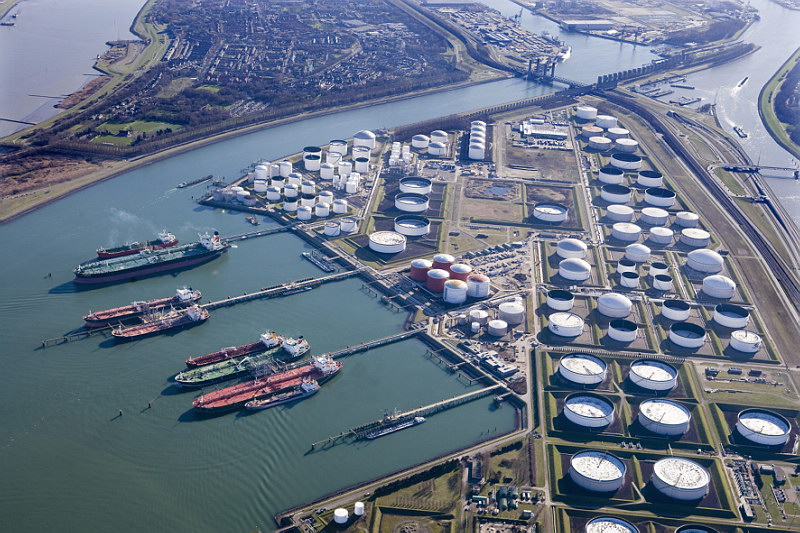
The Netherlands
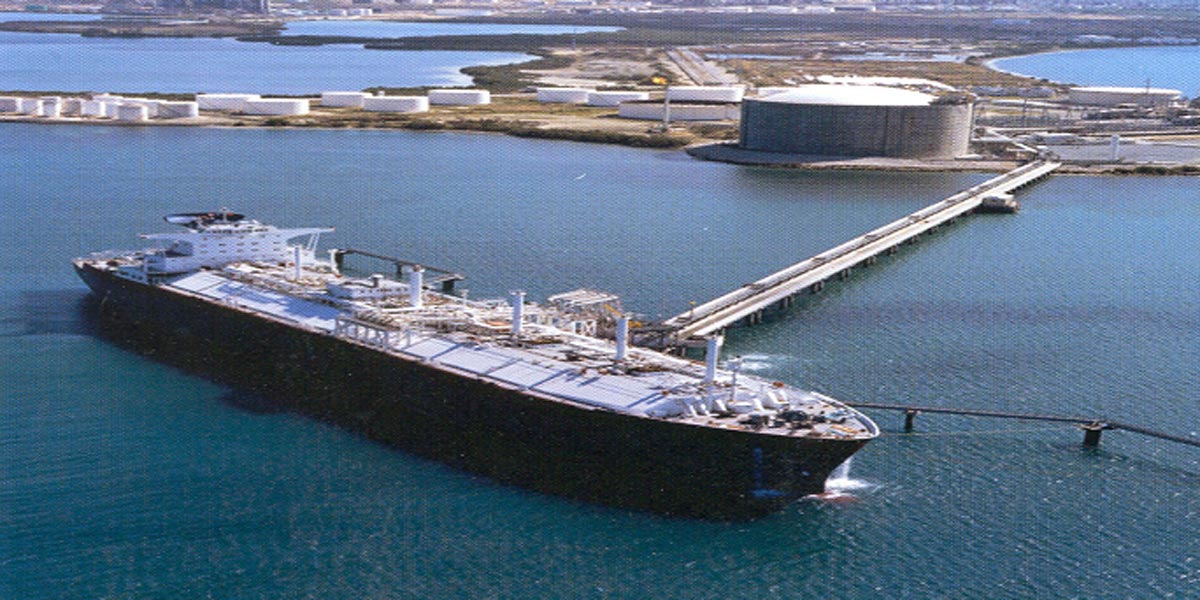
The Phillipines
Finally, here is a summary of
Local PNW untapped resources that could be harvested to
continue our reliance on fossil fuels.
Can't we just say no?
|