Word Wind Potentials and Wind Farms
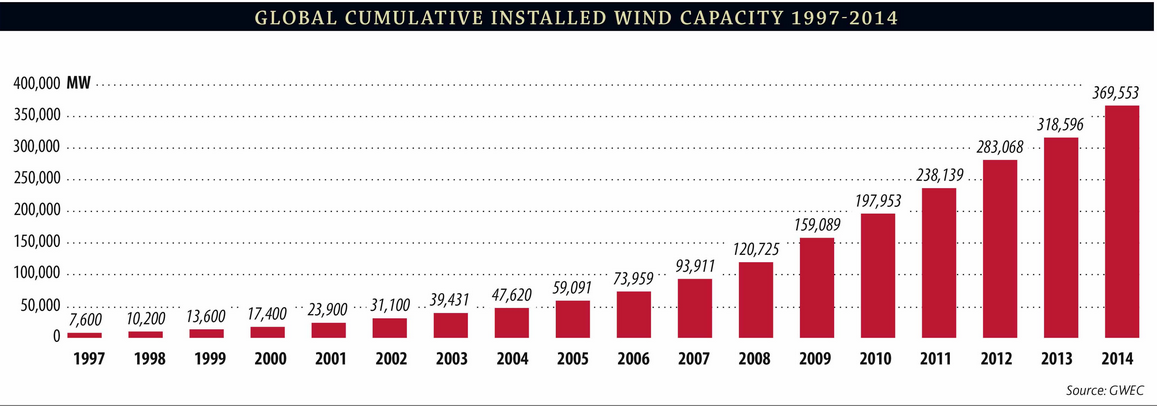 Here we see a fairly strong exponential growth of total (cumulative) installed wind capacity in units of MW and you can infer the growth rate from the data. As we will see in module 5-0 - the doubling time for exponential growth is 70/n years where n = percentage growth rate. A doubling time of 3 years implies a growth rate of 70/3 = 23% per year and that fits the data pretty well until recently:
So on a global basis, the wind energy supply chain is able (mostly) to keep up with this fairly constant growth rate/doubling time which would therefore make future predictions reliable. In 2012 the Earth was about a 4.5 TWe planet (uncertainty in this number is mostly due to China). So 283,000 MW of 4.5 TW is 6% of the total. If global demand grows at 4% per year (doubling time = 70/4 = 17.5 years) Then in 2030 the Earth will be at 9 TWe (wow, btw). If wind could be sustained at its current pace then we can just do the following simple calculation (and there is never any reason to do anything more complicated since exactitude makes no sense in these kinds of exercises, your merely trying to determing estimates and feasibility).
Clearly the above production is not likely to happen for investment and supply chain reasons (to be discussed later) so it always dangerous to take a growth rate when a technology first starts and pretend that it can scale to all levels of production. For instance, how much longer can this trajectory continue without running into material shortages and/or grid limitations? Indication of a global slow down is now present in the data 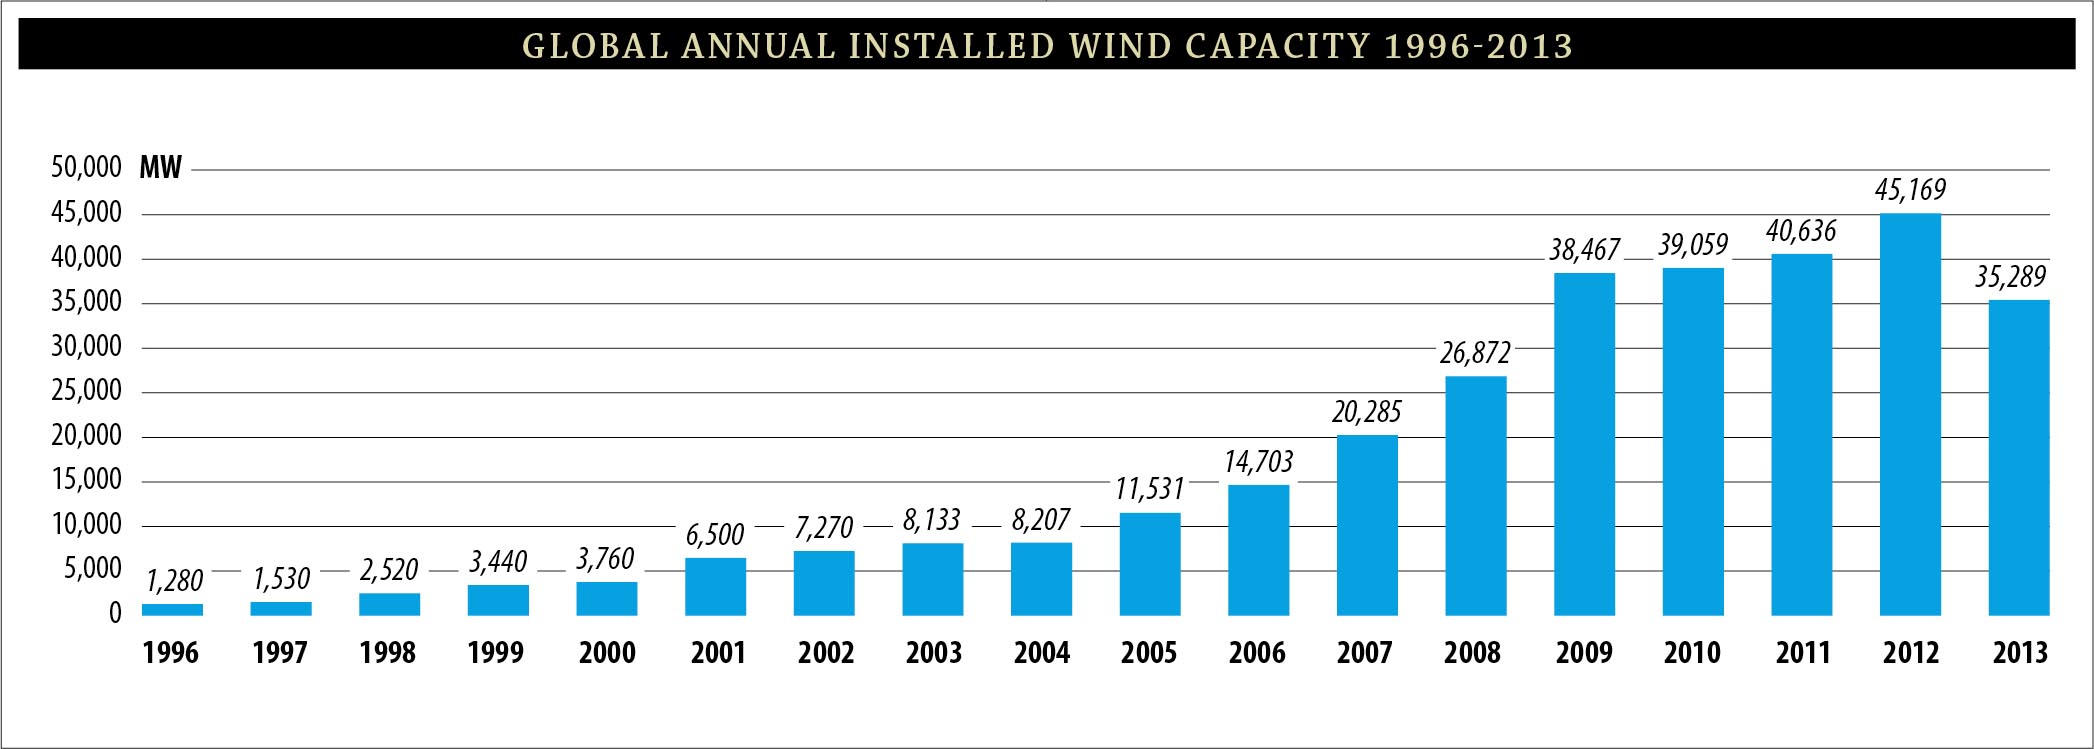 As of December 2012,2013,2014, here are the top 10 wind producing countries in the world. China is not only building dirty coal plants they are also amoung the world leaders in renewable energy build out. 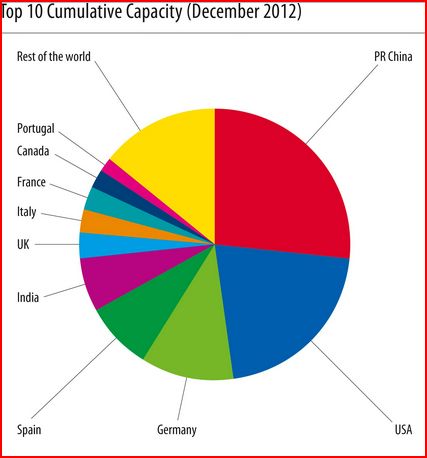 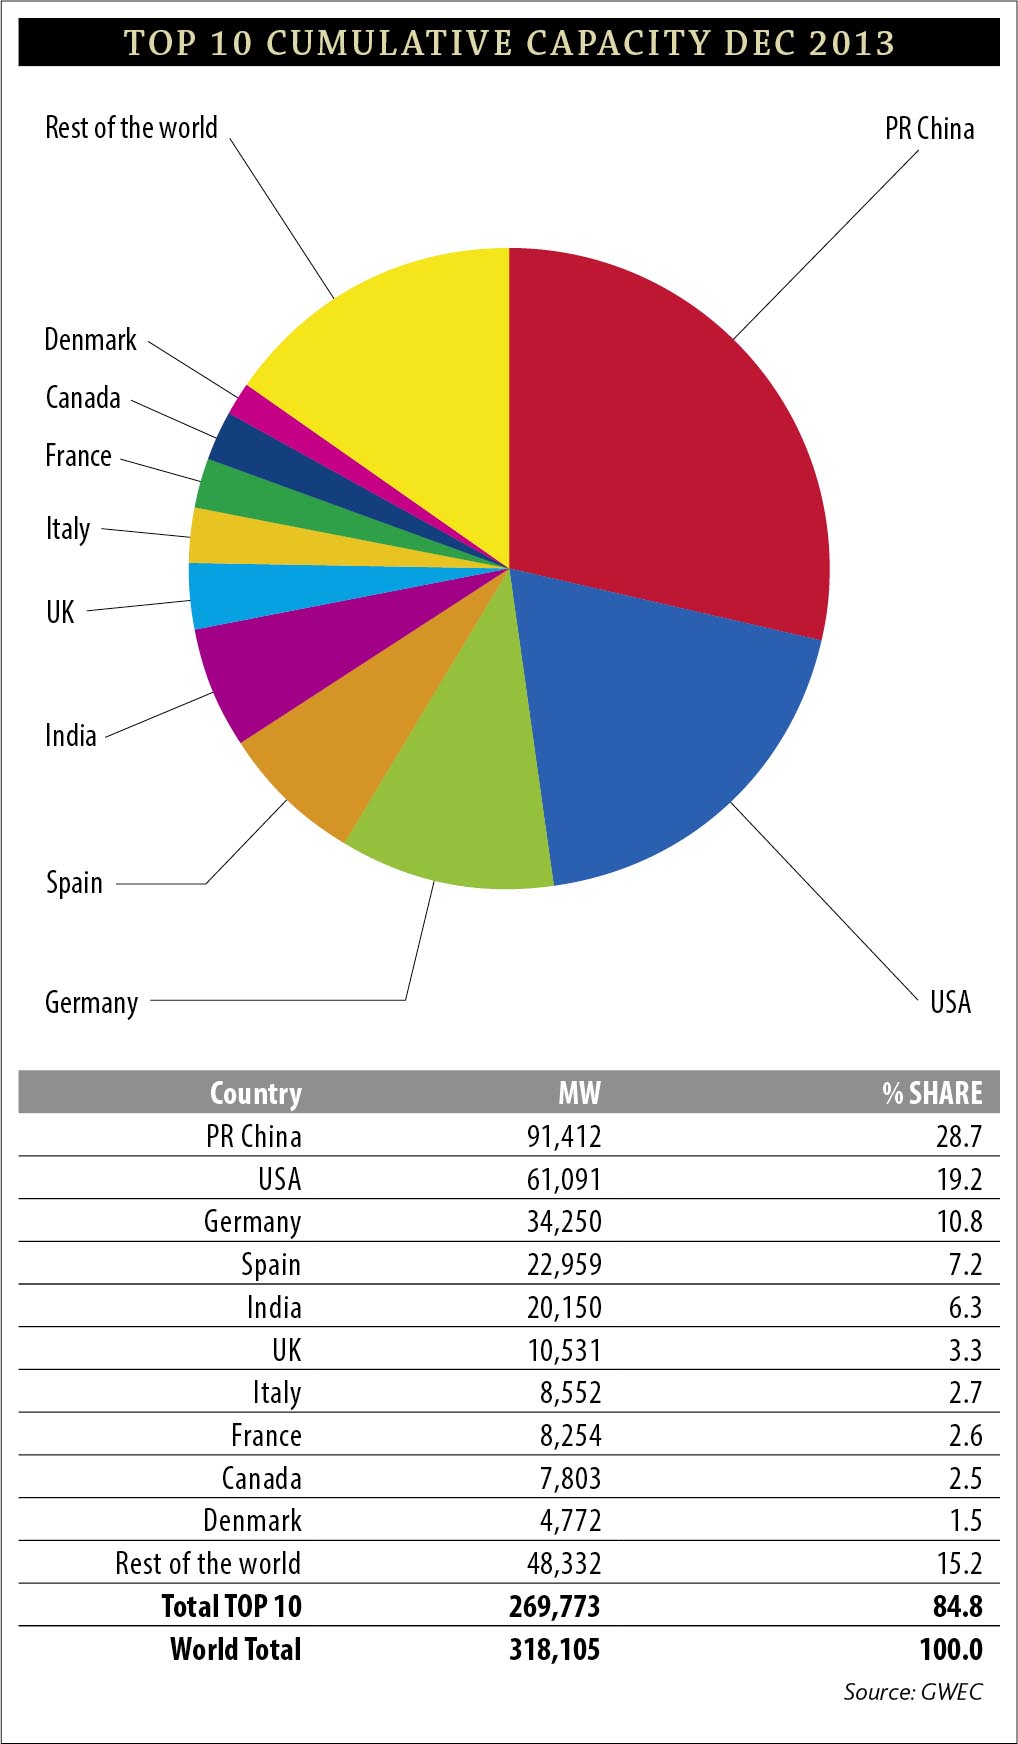 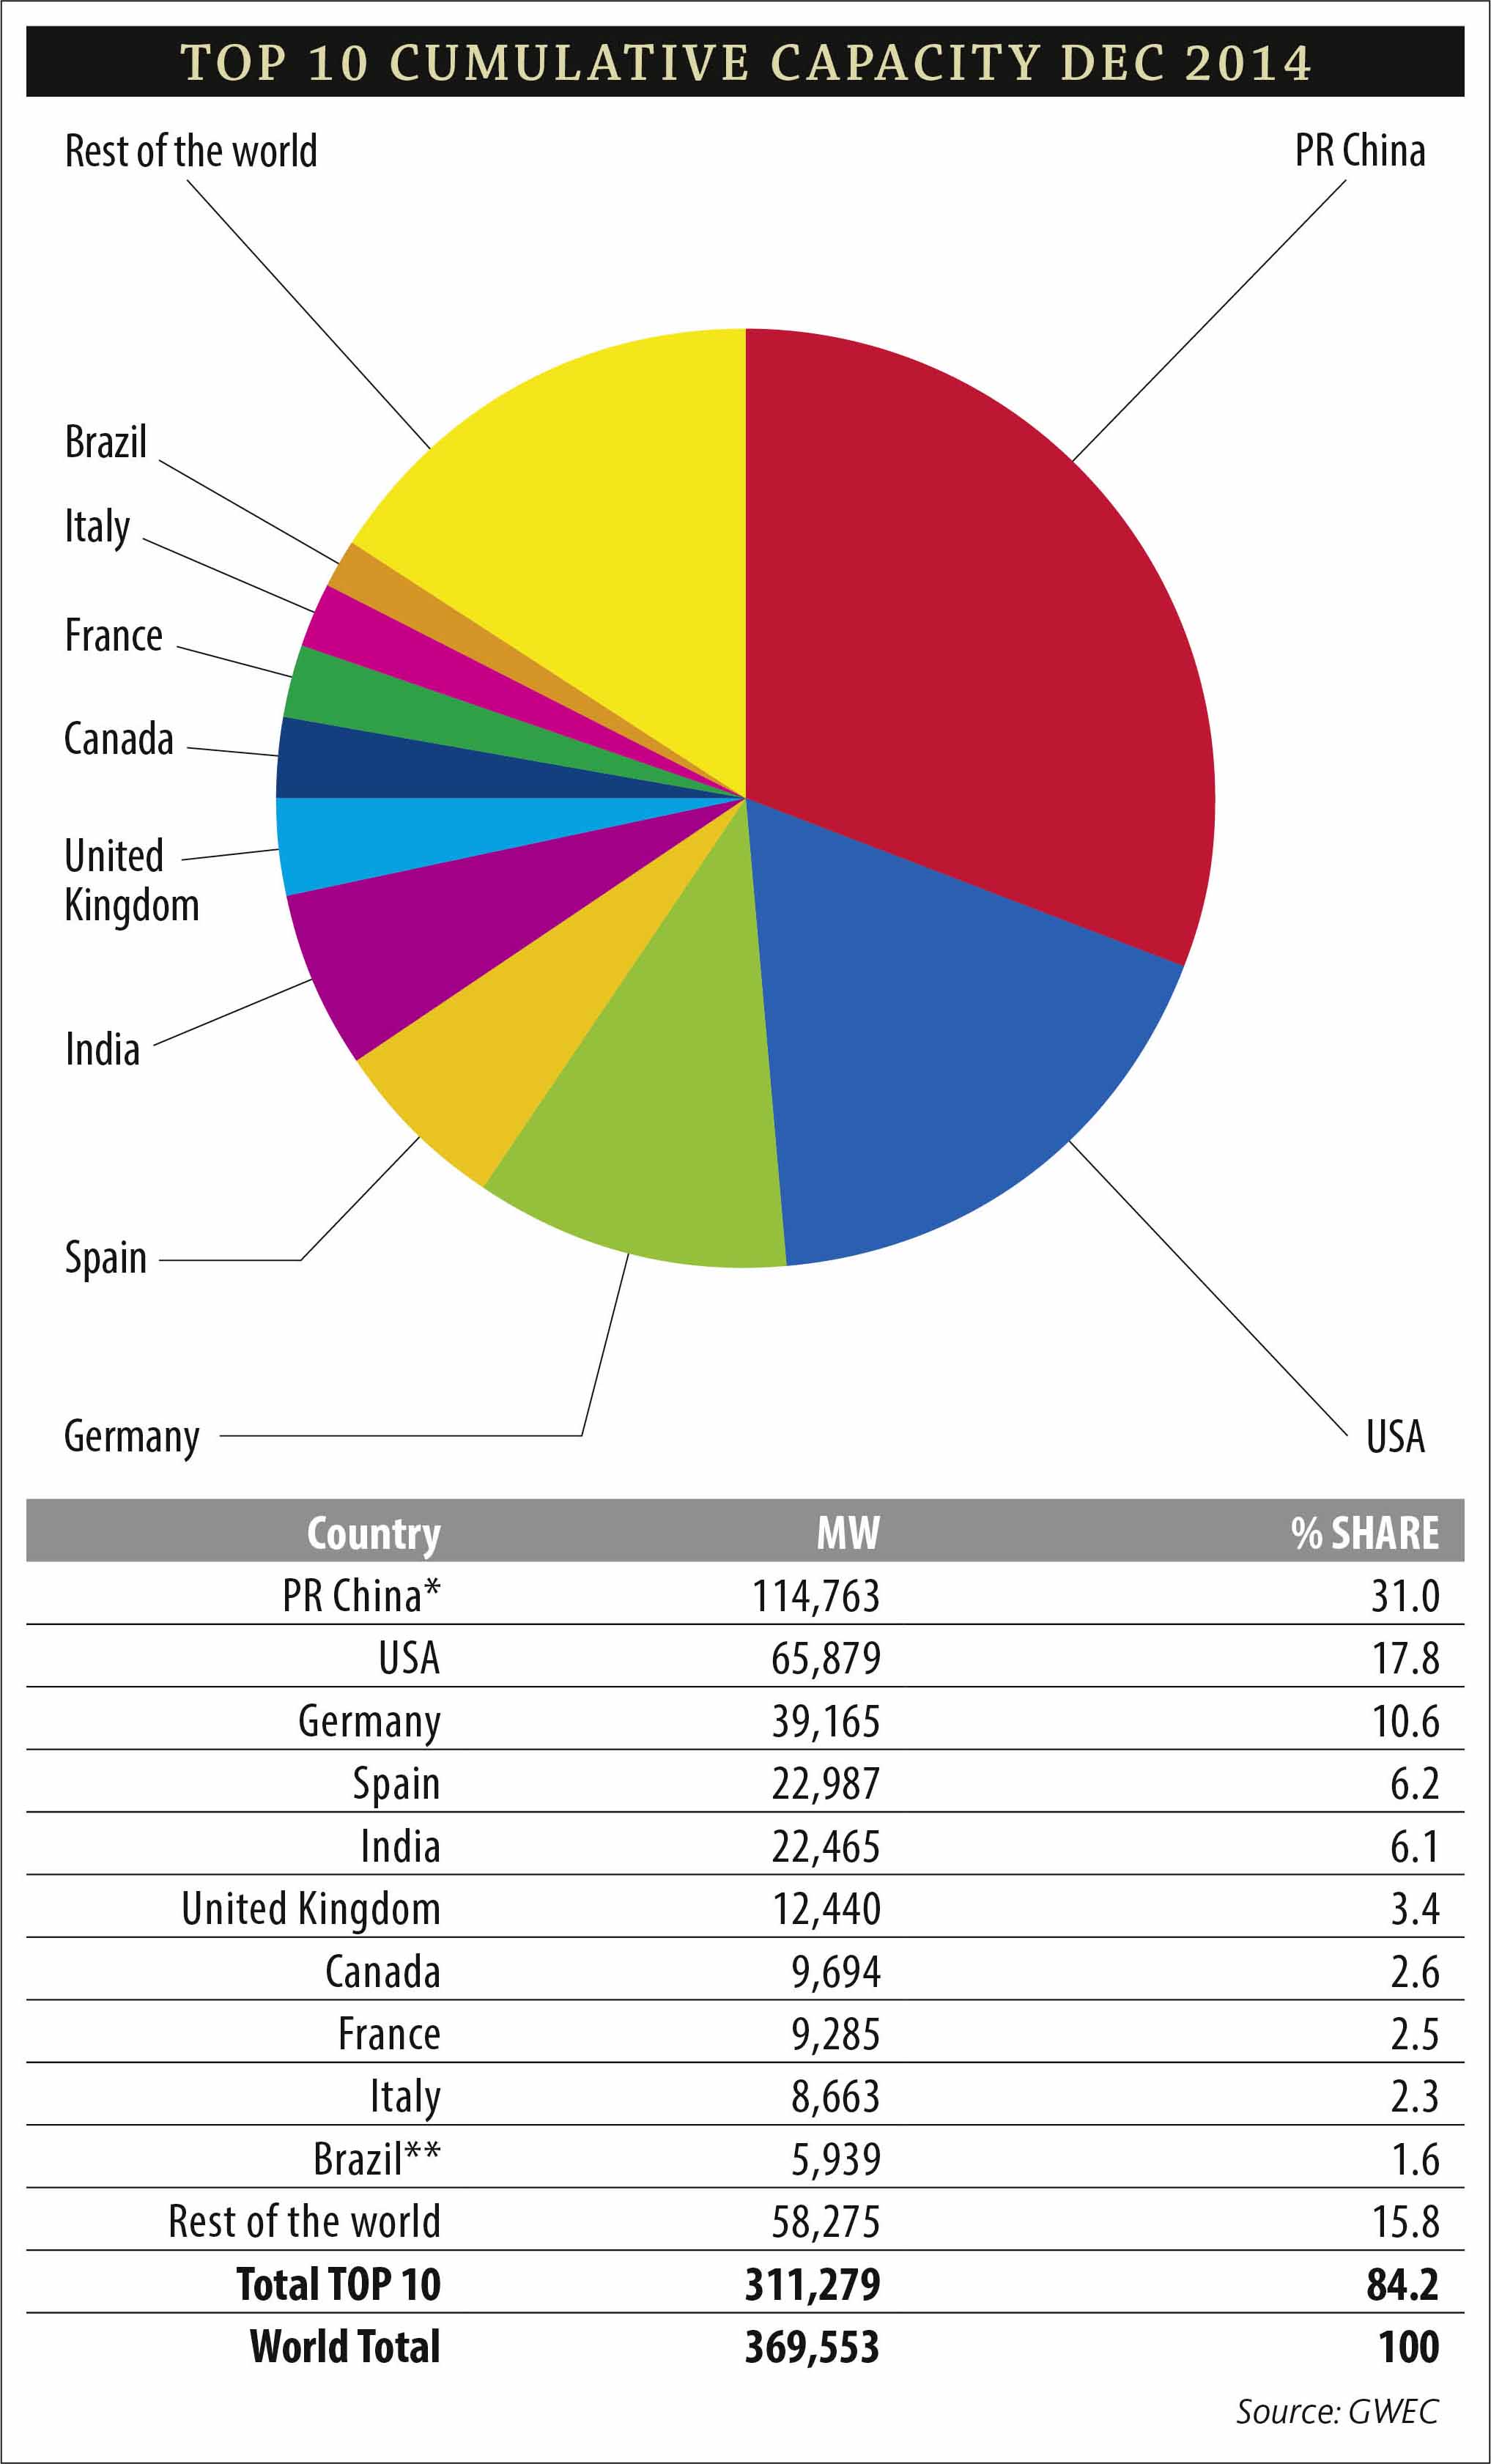 As of the end of 2012, total US installed wind capacity stood at 60,000 MW nameplate. While this is an impressive amount in absolute terms, 60,000 MW/1.36 TW is still only 4.4% of our total production porfolio.  Total Capacity as of July 2014 Note that OR + WA now equals Grand Coulee Dam nameplate (6000 MW)  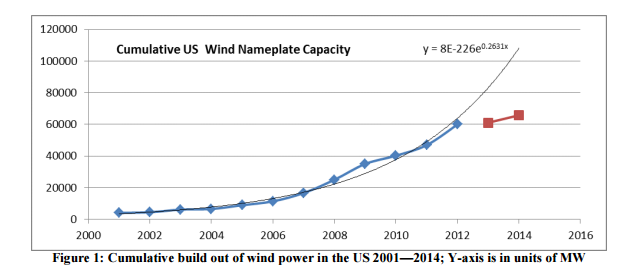
But Manufacturing Still Lags: Wind turbine manufacturing, however, has fallen behind 2008 levels in both announcements and in production activity. While this is bad news, the good news is that a solution is readily available: A strong national Renewable Electricity Standard (RES) will create the market certainty that manufacturers need in order to invest, enabling the U.S. to become a wind turbine manufacturing powerhouse creating hundreds of thousands of jobs.  but only if we committ to it.
Recent and very good analysis of the supply chain
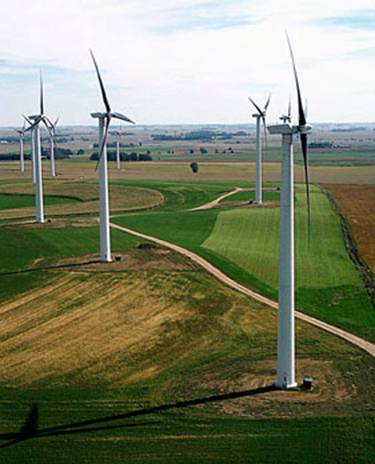
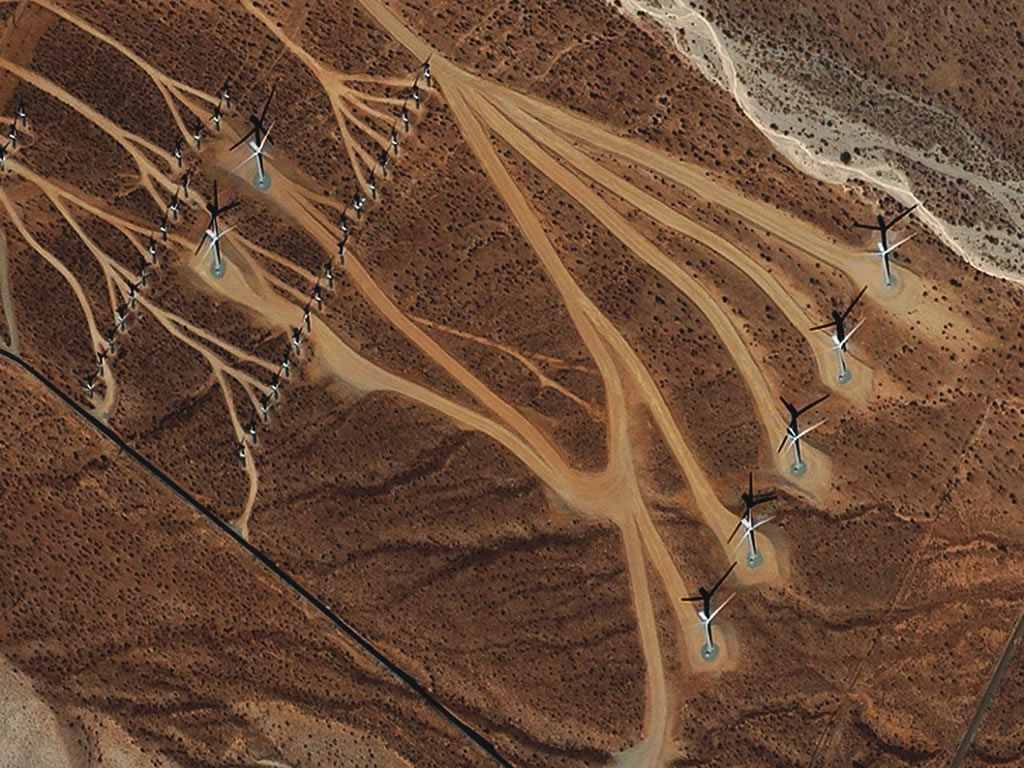
Wind farms even look pretty cool from Google Earth:
If you have Google Earth, go to the coordinates:
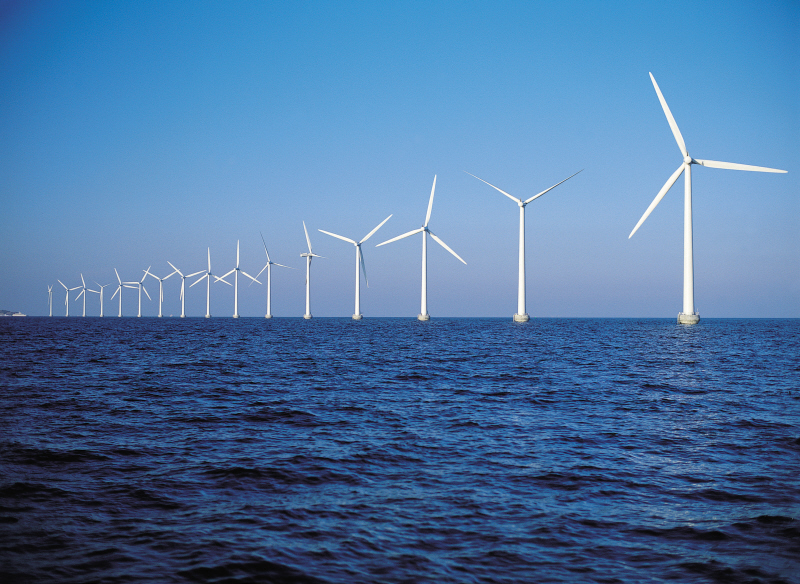
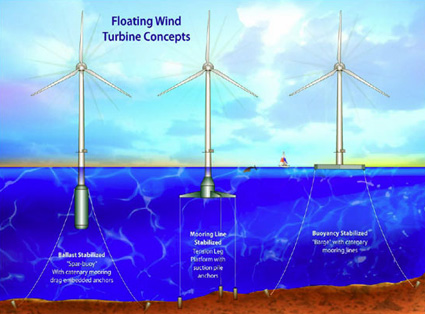
So far, we have only discussed the land potential of wind, but there is much more resource in OFF shore wind production. Of course, the difficulty there lies in extending the grid to such potential facilities. The use of hydrogen as a proxy for a transmission line may well come into play here.
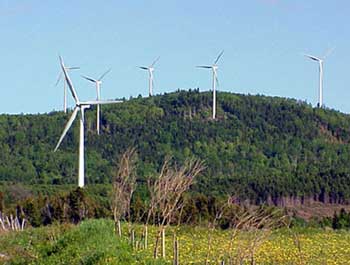
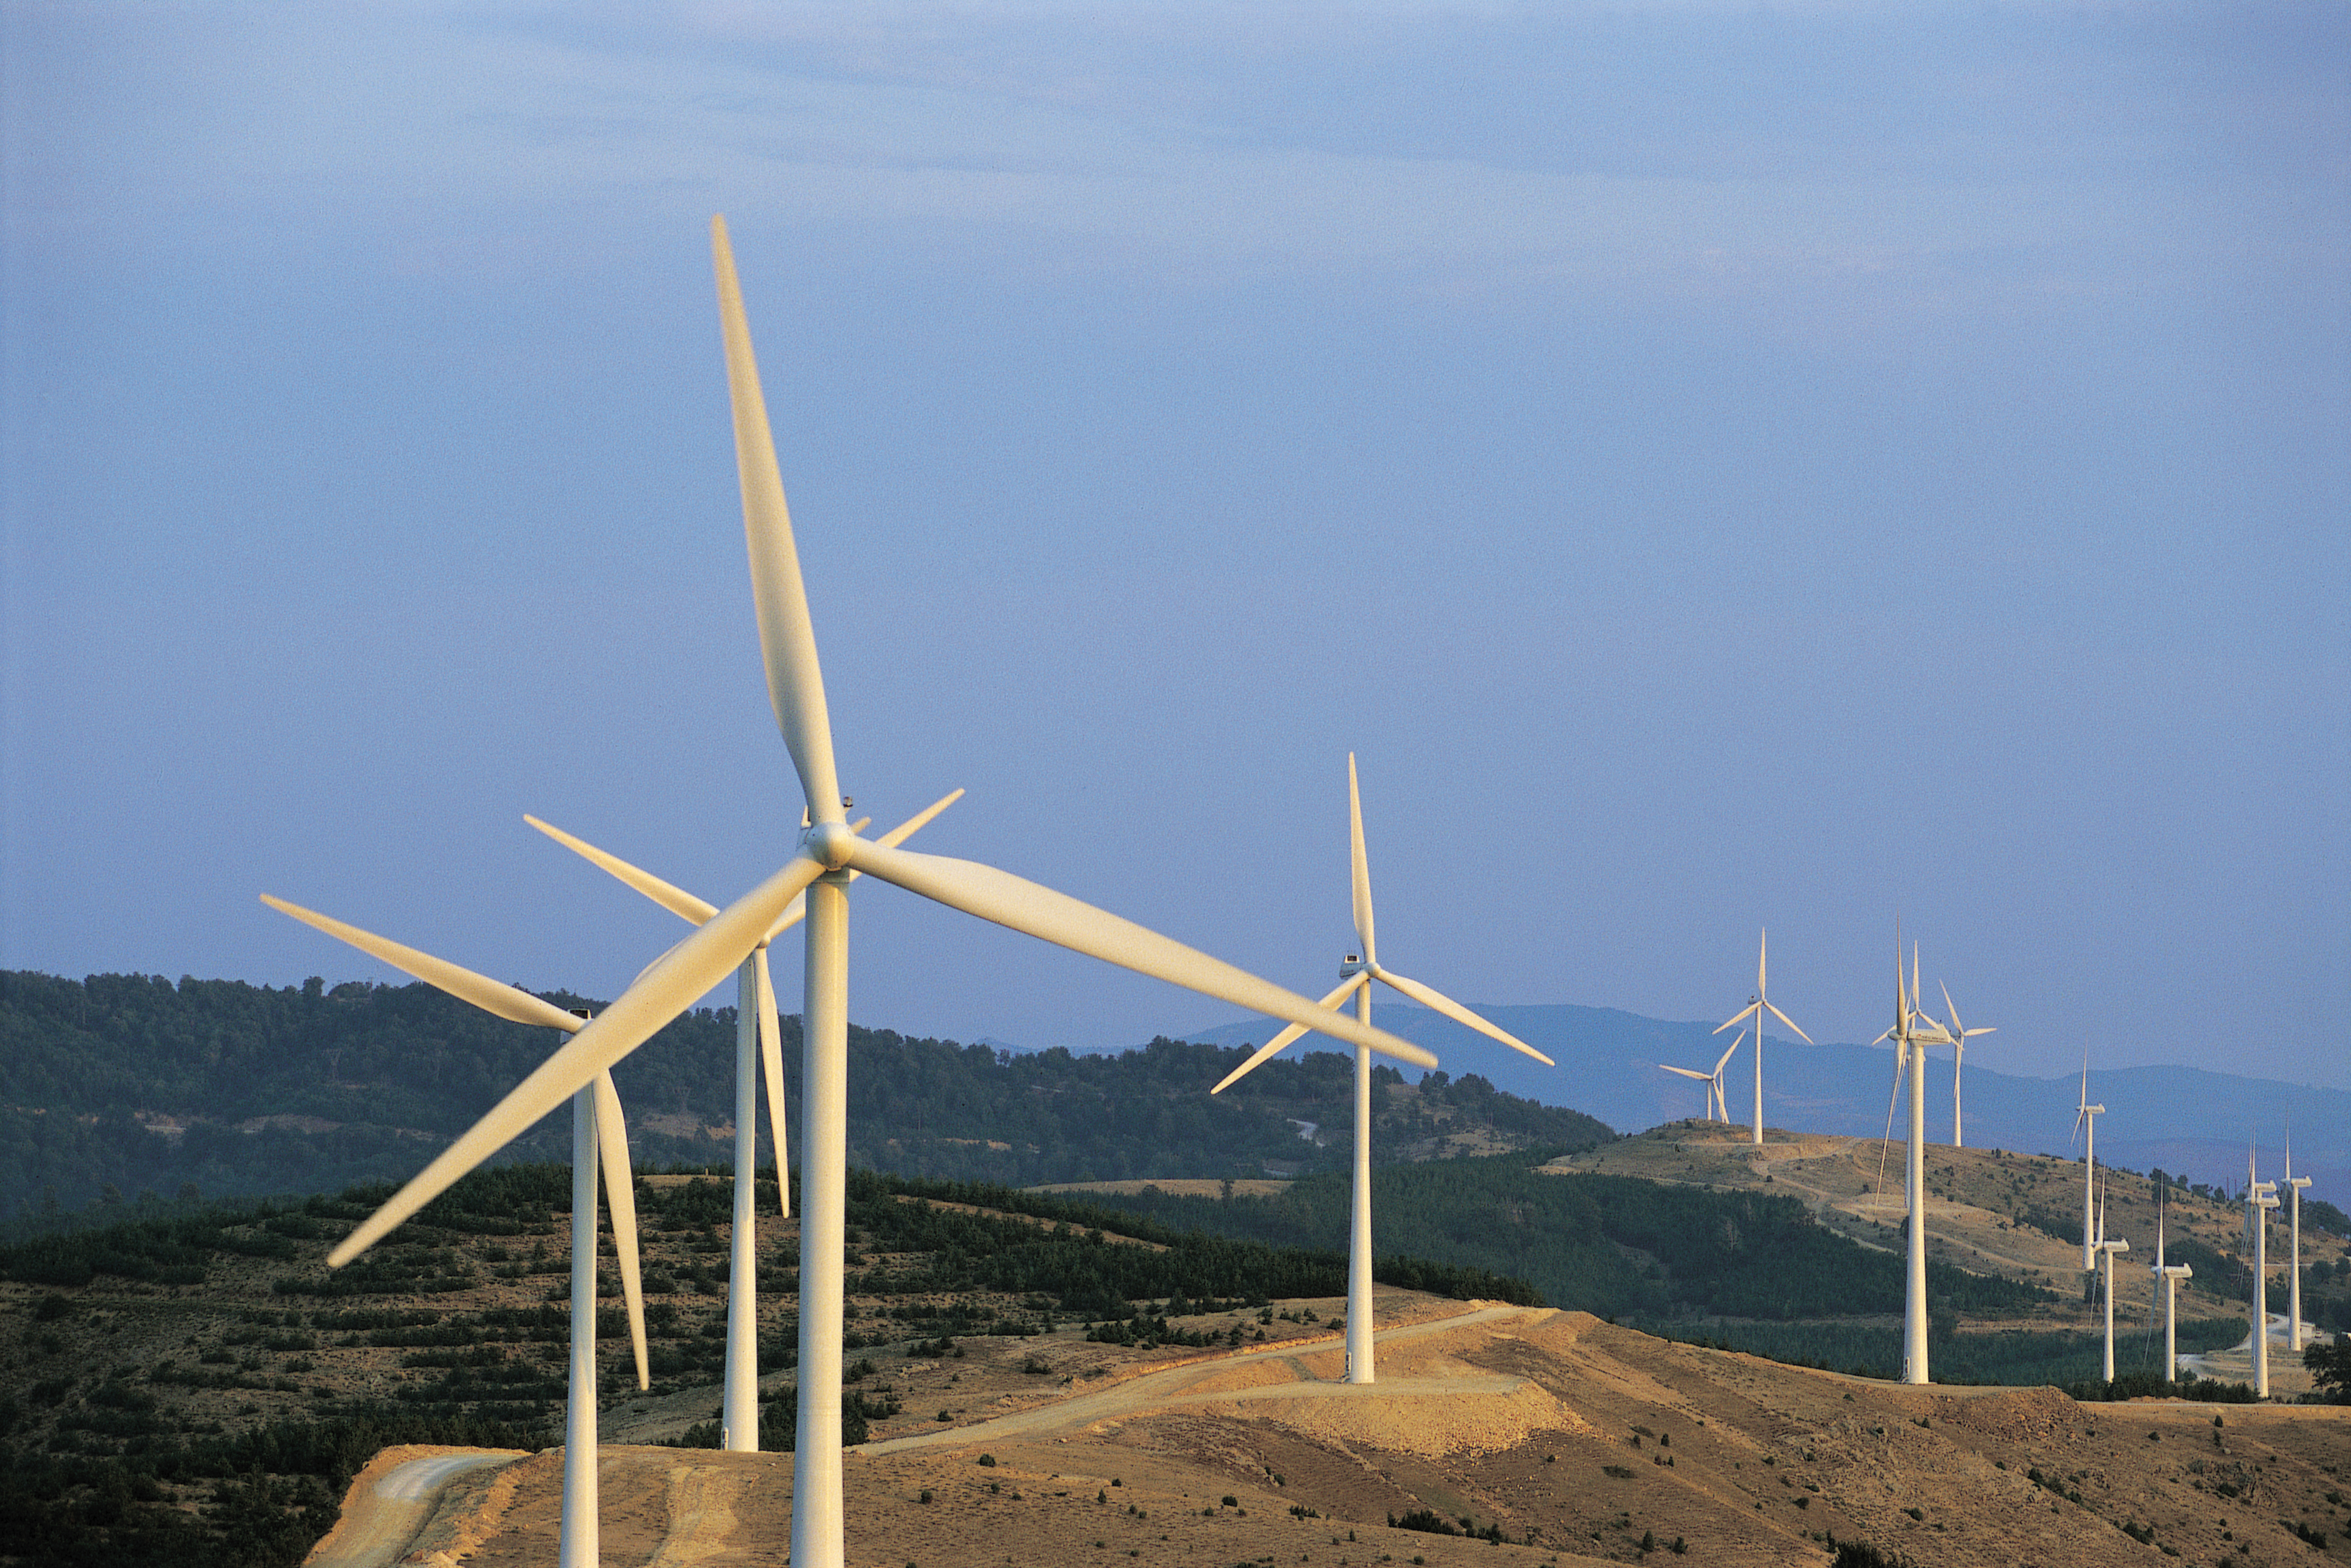
In addition, many mountain ridgelines represent natural wind funnels and lining them with turbines produces maximum efficiency.
|