In just the last two years, many new and comprehensive interactive datasets have become available which can be used to better assess the rate at which climate change is occurring on local, regional and global levels. An excellent example of this kind of interface is this newly developed website which utilizes the entire Google Maps infrastructure to dynamical zoom into various aspects of climate change in various locations within the state of California.
Similarly, the May 9 2014 release of the National Climate Assessment report contains mostly data driven analysis of the various aspects of climate change, concluding that climate change is happening now.
Shortly after the release of this report, the
National Climate Change Viewer (NCCV) came on line.
All of these tools now can be integrated together into a course which allows the students to examine the various aspects of climate change and their rates.
Currently climate change curriculum (including my own) is too often driven by professorial view points and perceptions as opposed to the actual data. Making the data case for climate change has always been difficult as the signal has to compete against many sources of noise, bias and volatility. However, there are now enough available data sets that an entire course can center on guided student exercises through data, using the scientific process of discovery, to build the case for climate change based on the preponderance of evidence. This course will then help to develop, what I think, "critical thinking" really is - the ability to synthesis multiple, and often ambiguous information and data sources into a coherent and objective description of the phenomena (in this case, regional and global climate change). Indeed, Munich RE (the largest re-insurance company of the world) is a good example of this kind of synthesis approach and serves as a model for how to integrate data analysis and risk assessment to provide a coherent overview of the current climate change situation
In addition to the content, this course will also introduce important data literacy skills to the participating students and improve their overall quantitative reasoning (QR) skills. Data literacy also entails training students on issues related to data bias (an extant problem in much climate data), data incompleteness and data ambiguity. Indeed, a major piece of core data literacy involves dealing with noisy data that can support several different viewpoints. The overall ability to resolve ambiguity is also a necessary component of critical thinking. While climate change is the content driver, a principle objective of this proposed course is to improve the overall QR skills of these students.
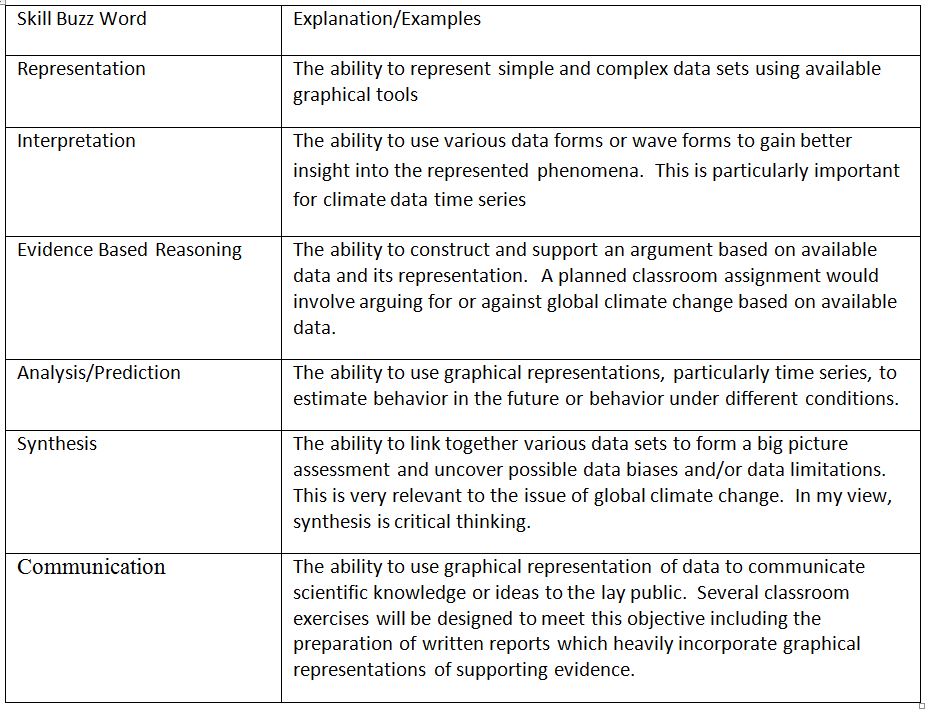
Just as in the case of "critical thinking", student learning outcomes and/or course objectives are highly dependent upon the definition of quantitative reasoning. While there is no one, universal definition, the following table outlines 6 observable skills that can be reasonably associated with QR and that will be designed into the proposed class:
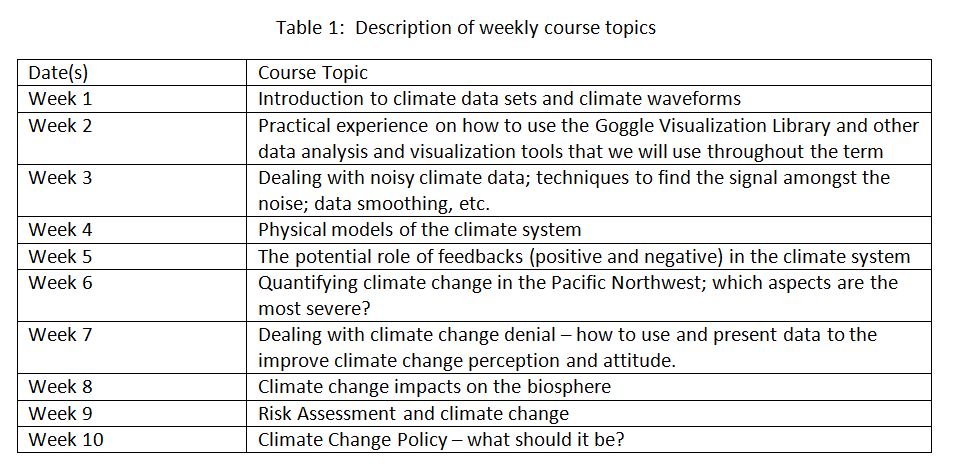
Weekly Topics:
The table below outlines the weekly topics that will likely happen in this proposed course. In addition, as in all my previous honors college courses there will be 3 team presentations that happen during the term (you can observe many of these on my YouTube channel). These presentations are integral in establishing group collaborative skills and project definition and execution.
In sum, this proposed course examines the data driven case for the occurrence of multiple aspects of climate change at different spatial and temporal scales. Students will learn how to make and present data driven cases for climate change. This course also affords the opportunity to discuss the ideas of perceived vulnerability and policy responses with regard to scientific data in the context of better adaptation for the coming, possible severe nature of global climate change.
Example Course Readings related to the weekly topics:
|