Climate change is hard to detect from data
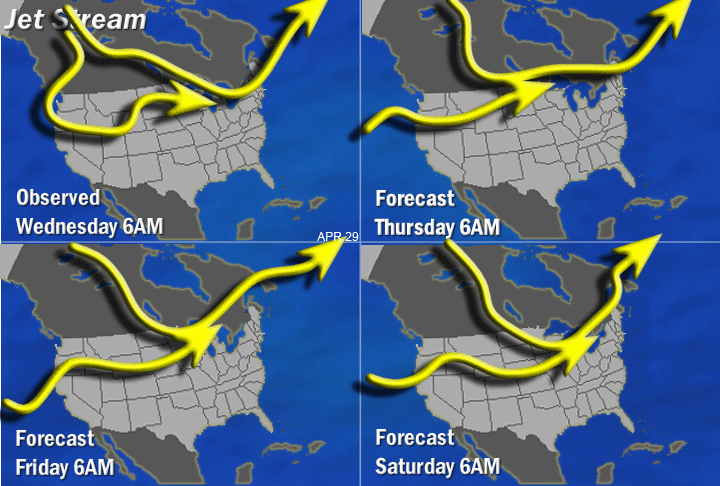
 The various peaks and throughs define regions of high and low pressure which look like this, when mapped on to the surface:
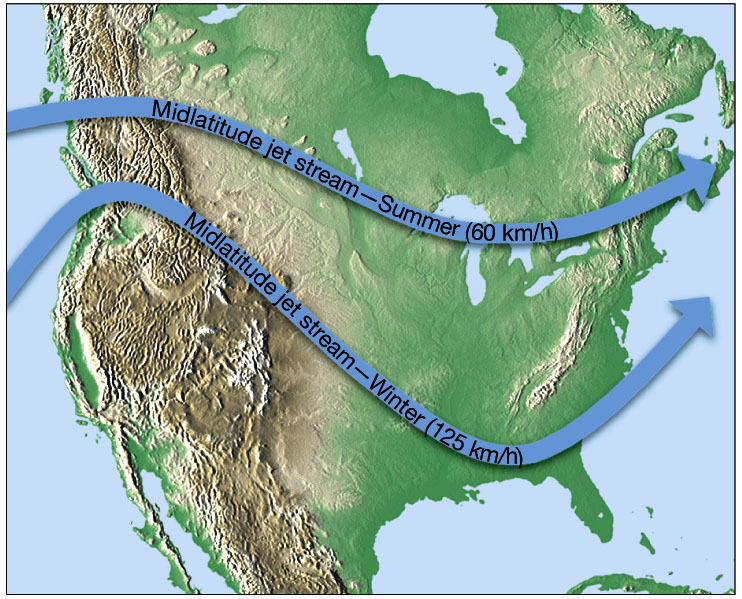
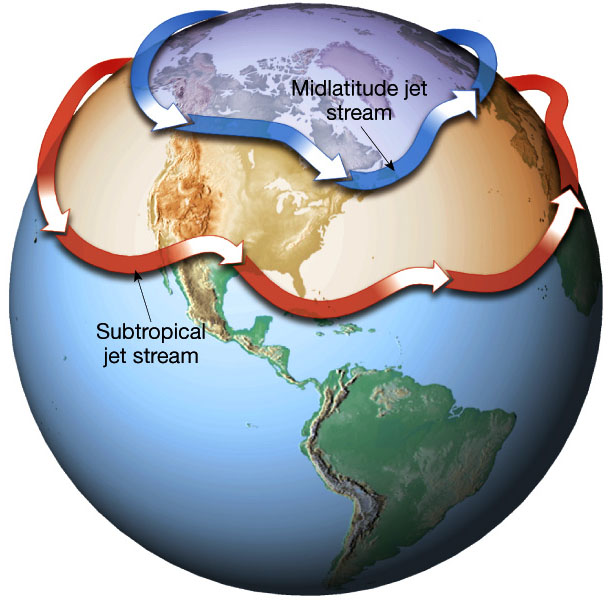
Abnormal regional weather is generally the result of seasonal displacement in "normal" jet stream patterns. In general, the position of the aujet stream determines the local weather for a period of 3-5 days. In the summer, the Pacific Northwest is usually dominated by a very stable, high pressure ridge, resulting in a north wind and dry, sunny conditions.
August 12, 2007 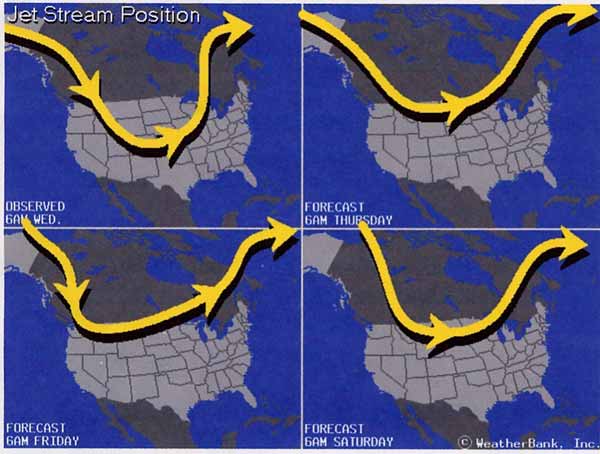 The effect of the oceans, however, is to change the placement of the jet stream pattern for muliple reasons:
Ocean Cycles:
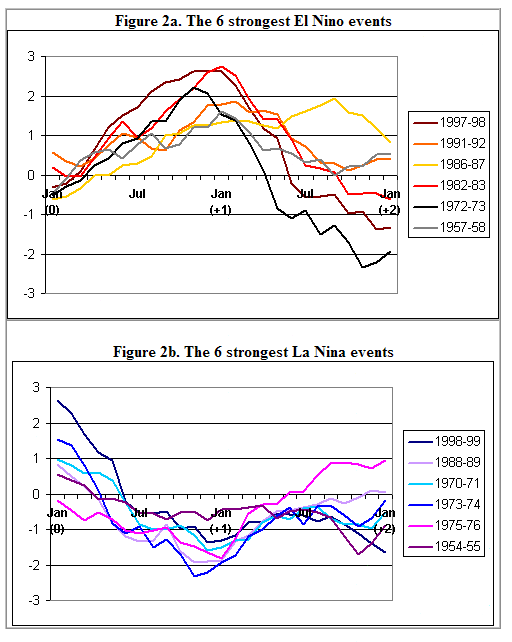
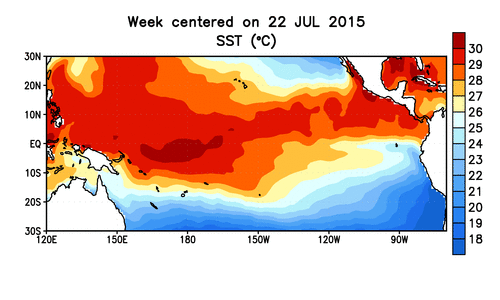
The most well known cycle is El Nino/La Nina. These events are driven by
changes in the trade wind pattern that ultimately determine the equatorial
surface temperature (warmer - El Nino; cooler La Nina) of the oceans.
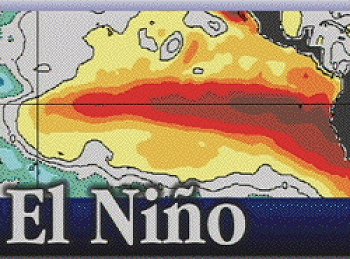
The formation of El Nino is linked with the cycling of a Pacific Ocean circulation pattern known as the El Nino Southern Oscillation or ENSO. In a normal year, low atmospheric pressure develops over northern Australia and Indonesia, with an anticyclone or high pressure over the equatorial Pacific. Consequently, trade winds over the Pacific move from east to west. The easterly flow of the trade winds carries warm surface waters westward bring convective storms to Indonesia and coastal Australia. Along the coast of Peru and Ecuador, cold bottom water wells up to the surface to replace the warm water that is pulled to the west.
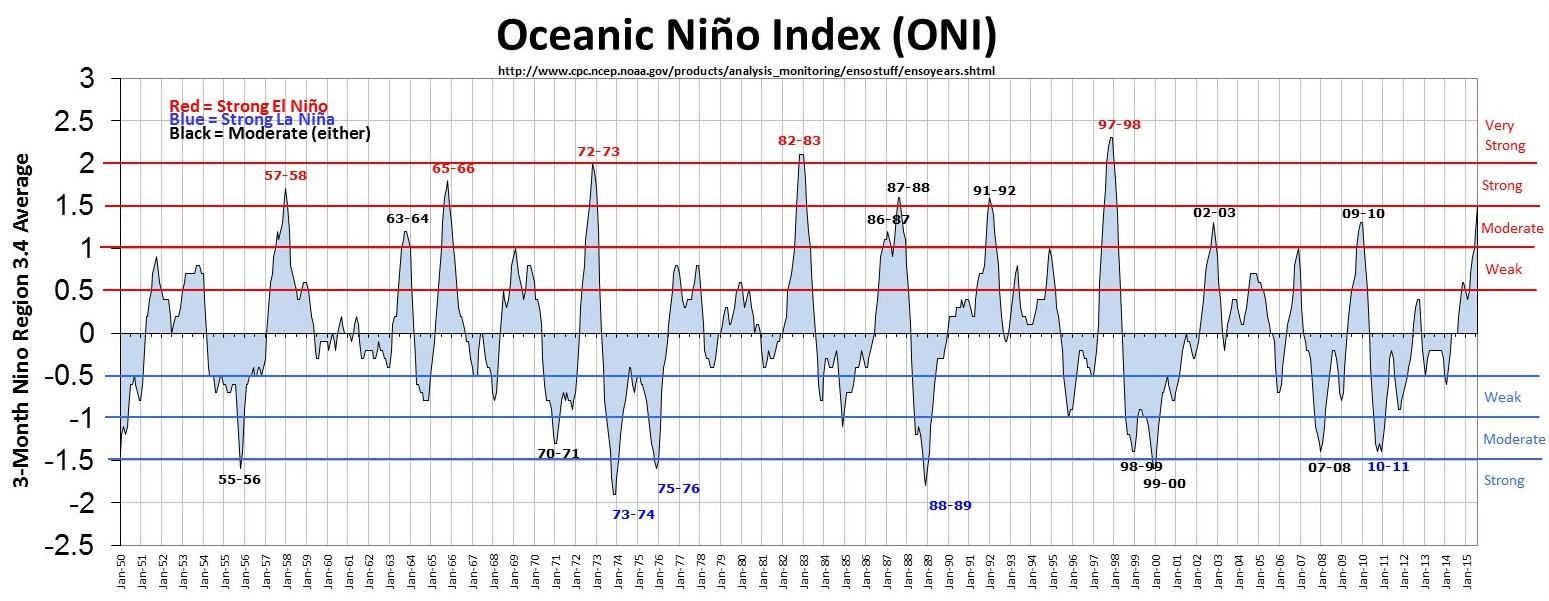
For a while there was a strong El nino (> +1.5) every 7-10 years, then there was a 15 year gap and then there was a 17 year gap (i.e. until 2015). For La Nina there was a cluster of events in the 1970s and again from 2008 through 2012. So there does not appear to be a "characteristic" time scale over the period of record 1950-2015. During El Nino, the PNW is usually characterized by the maintenaince of the high pressure ridge so its warmer and drier. 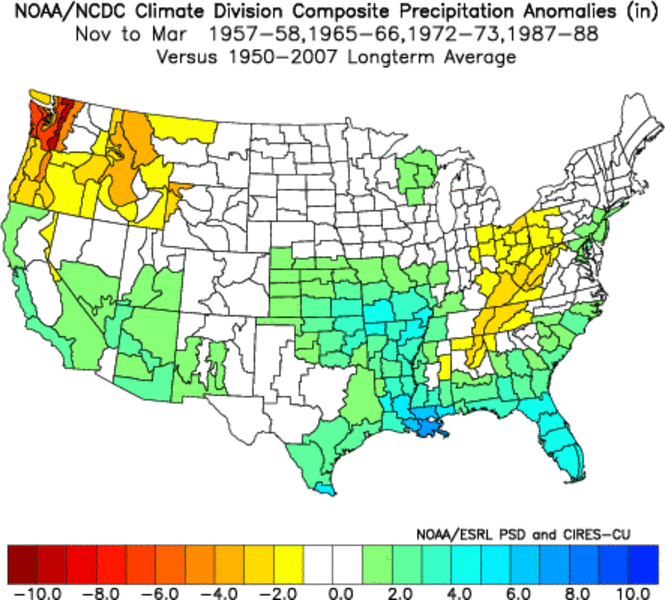
But "super El Ninos" are quite different and California gets very wet. (this is unlikely to happen this time around). 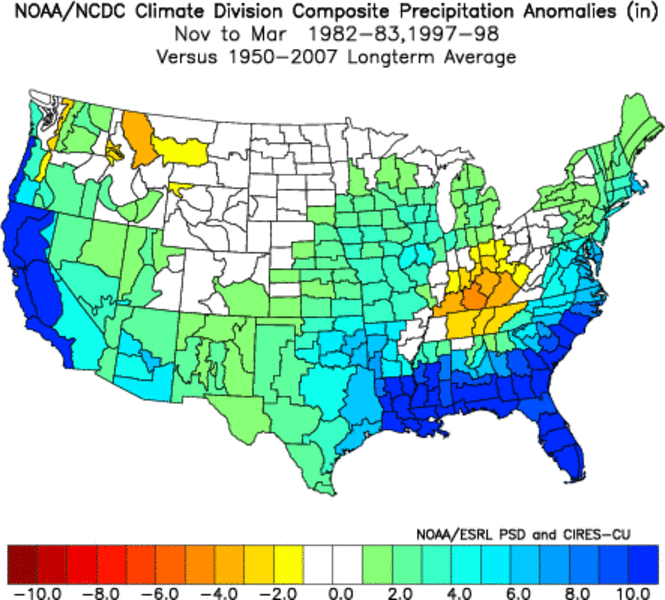
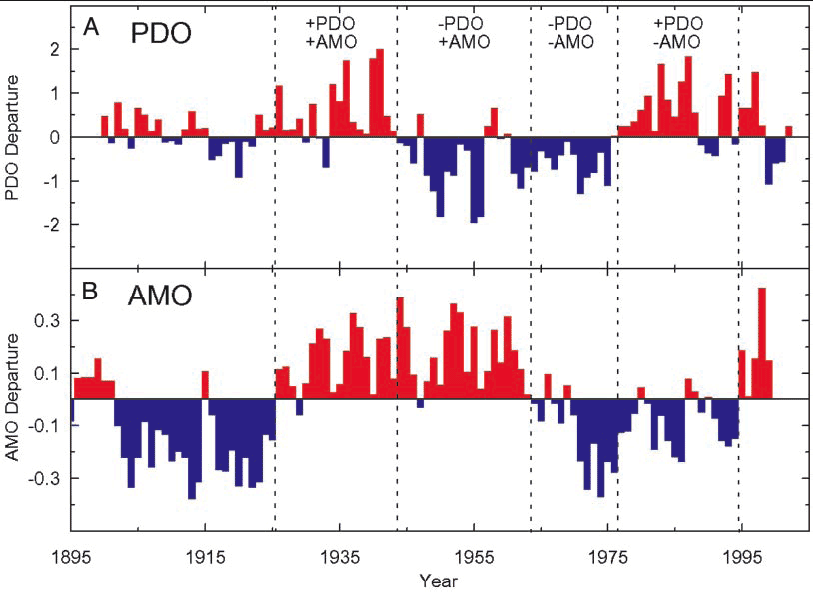
During La Nina, the
PNW is subject to a cooler
and wetter conditions. The La Nina season of 2007/2008 is similar to
the strong La Nina PNW conditions of 1970-72
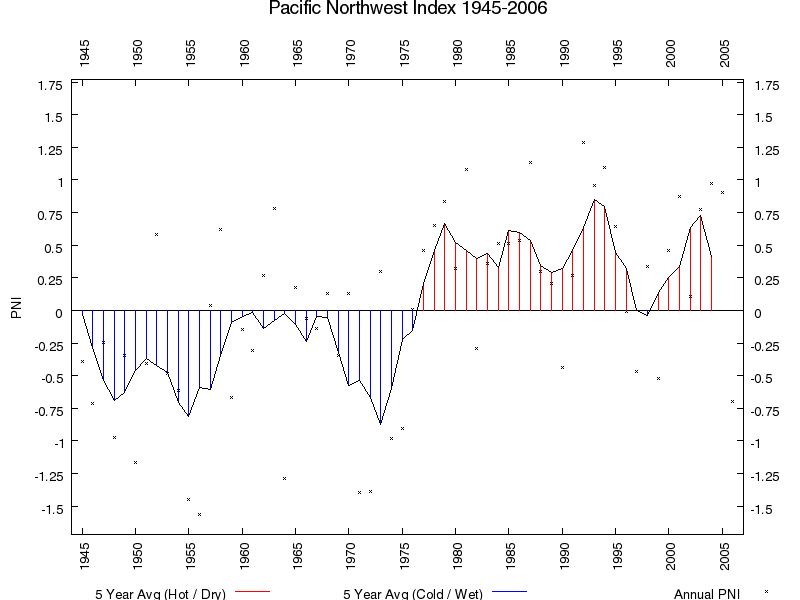
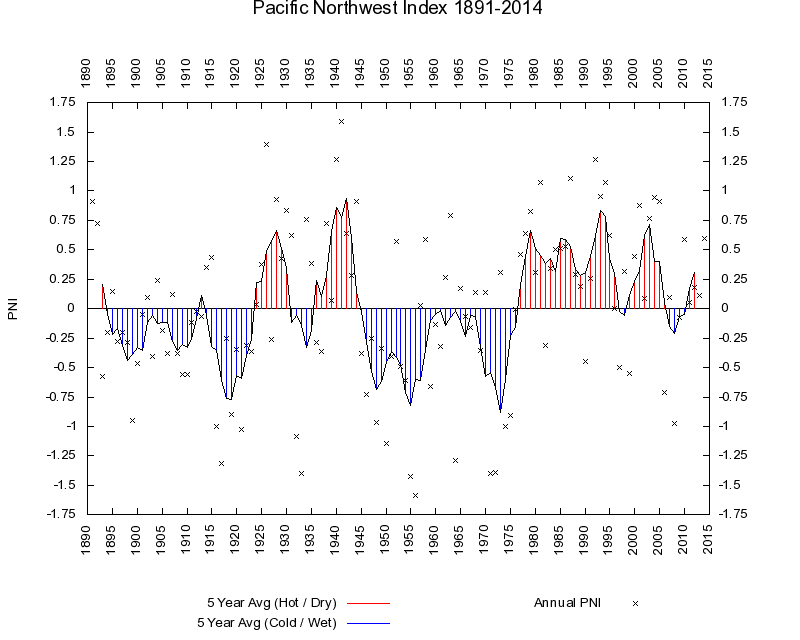
Note the cluster of strong La Nina events in the 1970s which is statistically anamolous (relative to 100 year baseline). During that time there was significant snowpack in the Cascades and quite wet weather in Western Washington. But this period did not represent a "normal climate". However, the multi-decadel oscillations seen in the Pacific Northwest Index (see above) are not consistent with the El Nino, La Nina timescales.
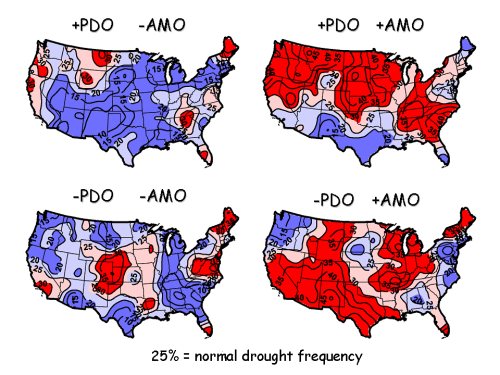
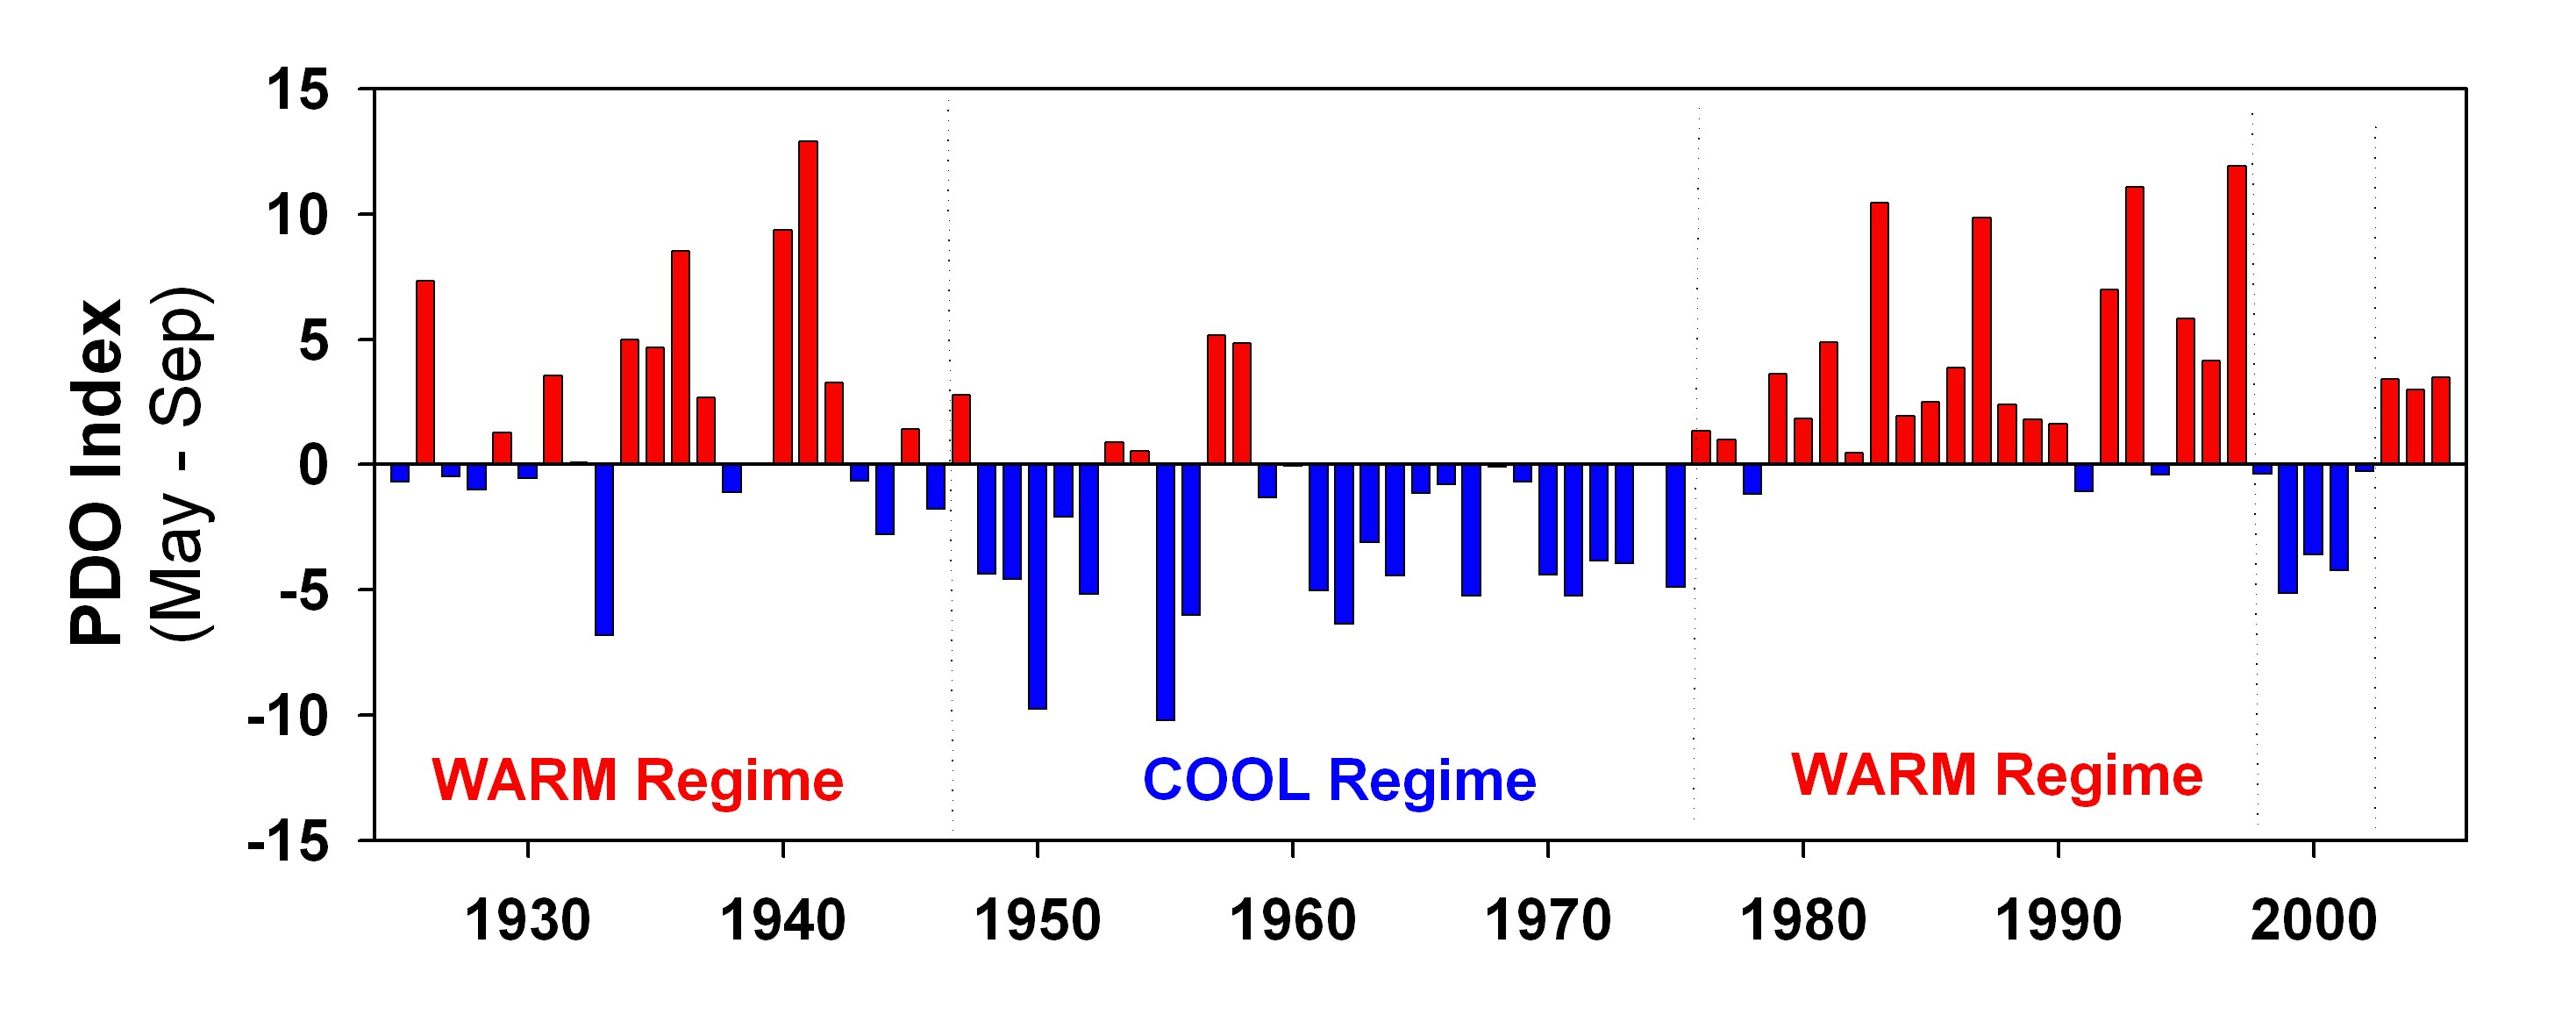
 Enter now the Pacific Decadel Oscillation (PDO) which does have the correct timescale:
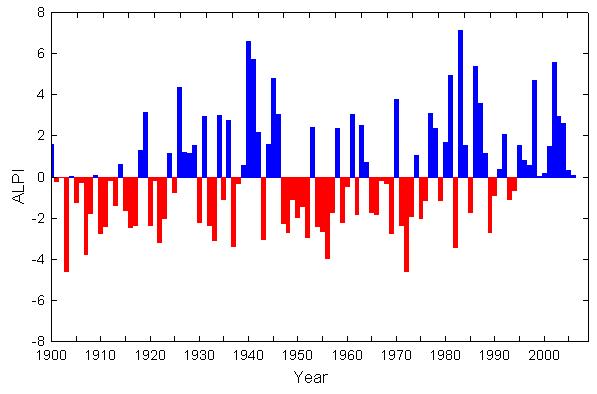
 We also now have the Aleutian Pacific Index, which is a measure of the mean baromoteric pressure of the winter time Aleutian Low Pressure system. This basically determines the rainfall amounts in the PNW during winter time. Blue is intense low pressure. These variations are closer to the El Nino timescales than the PDO time scales.
Since these cycles have different timescales, there can be occurences of mutual reinforcement or mutual cancellation. That is the biggest driver on annual PNW snowfall.
 Of course, there is also an oscillation in the Atlantic called the Altantic Mean Oscilliation:
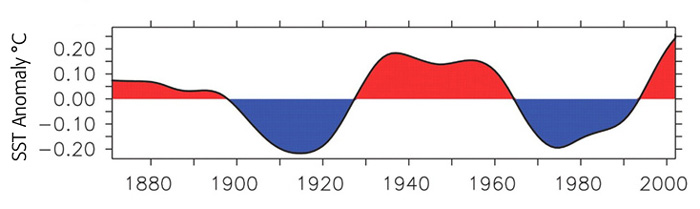
THe PDO + AMO cycles are not in phase:
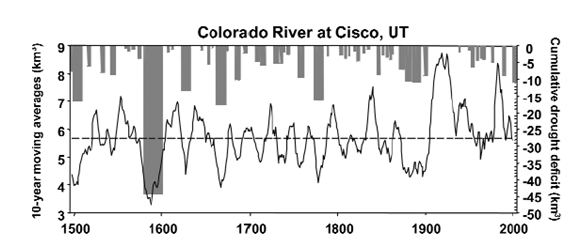
And these is a major driver of US precipitation Patterns
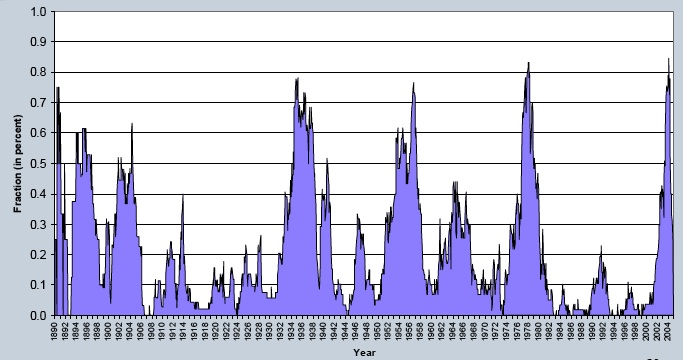
as well as regional ones (Colorado Drought Index)
|
 it is this mechanism that influences jet stream patterns.