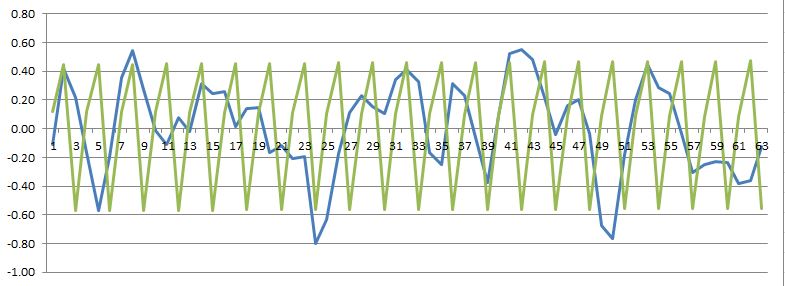
From the spreadsheet here is a comparison of the smoothed El Nino data (BLUE) (Column P) fit to a sign wave period of 3 years (GREEN). While the GREEN line does hit some of the blue peaks its is not, overall a good fit.
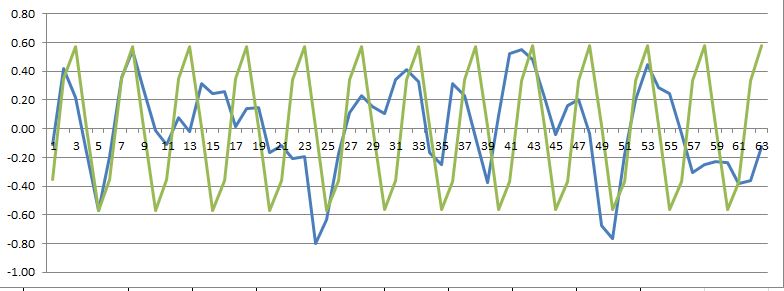
The following two figures show attempts for a period of 5 and then 7 years.
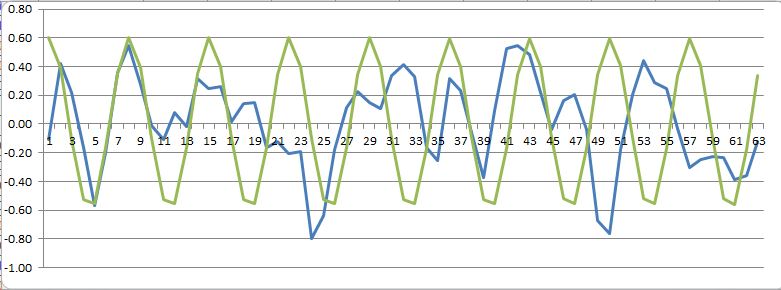
The 7 year fit actually starts out okay but by time step 45 (1994) that fit is now well out of phase. So if there is a characteristic time scale for El Nino to occur, its changing ovr the period of record of the data (1950-2015).
|