Upload your assignment here:
The central england temperature record is a set of fairly reliable temperature measurments for this region going back to 1659. Its the longest reliable temperature record of any region in the world.
This exercise will deal with just part of this data, from 1878 to present.
As background material on smoothing operations on noisy data, it is essential that you read this primer .
Instructions:
This assignment is not all that demanding. There are two input data files and in a single program you should be able to process these input files to meet the requirements of the assignment. This is what progamming is about, after all!
- Download the following two data sets. These are both .txt files.
The format is pretty simple. The first column is the year and the subsequent 12 columns are monthly averages in degrees C.
Smooth both the maximum and minimum data using:
- box car (moving average) of width 5 years
- Gaussian kernel of width 7 years
- Exponential smoothing
Plot all three smoothing waveforms on the same graph and comment on any differences that you notice in smoothing procedure.
- Gaming the result:
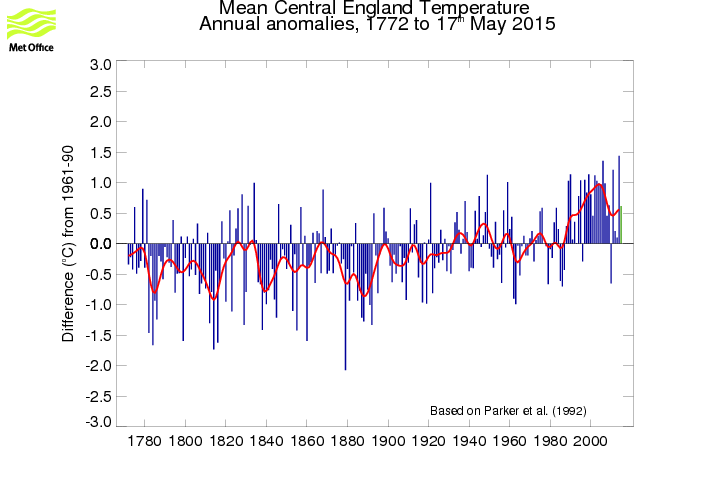
Climate data is often plotted a temperature anamoly where individual temperatures are compared to some "baseline". That is, over some time period, the average January Max temperature is X and if say an individual January had max temperature of X +0.5 then that would be an anamoly of +0.5.
For example, in this case a baseline of 30 years is used (1961-1990) for annual temperatues:

The choice of baseline, however, is arbitrary.
Produce a temprature anomaly plot by using two different baselines for each of the two data sets. Baseline 1 is 30 years long (1961-1990); baseline 2 is 100 years long (1880-1980).
- Now, why do we want to learn how to program? Well, so we can cheat. There is likely some baseline length which will produce the maximum positive temperature anomalies over say the
last 10 years. Then, using that baseline, we can write a paper about global warming.
Therefore, write a program that uses random beginnings and endings of baseline period (minimum time of 30 years) that will maximize the average temperature anamoly over the period 2000-2010. Do this for both the minimum and maximum temp data and produce the relevant plot and report on your code. - (note this is an introduction, through practice, to the art of blind parameter searching, which we will discuss more in class on Friday).
- Instead of dealing with annual baslines, let's seasonlize the data and look only at Summer (June, July, August) and winter data. Define the winter season as 4 months (Nov, Dec, Jan Feb) - yes this is a pain because the season data is now on 2 lines - this is why you program and format, etc, etc, to deal with this stuff easily. Using the basline optimization program that you just wrote, produce the seasonal tempearatue anomalies (that maximize the warming residual) for the min and max data for the two seasons (so you are producing 4 plots).
- For the period prior to 1960, determine the average number of negative average minimum temperature months per decade from the data. Use that expectation value and poisson statistics to determine that probability that over the 10 year period 2000-2009 there would be 0 events.
Simple tutorial on Poisson statistics
This is due by 10 pm on Thursday May 21
|
