FLEET Model TutorialPathways Selection Area continued:(back to Pathways Selection Area part 1)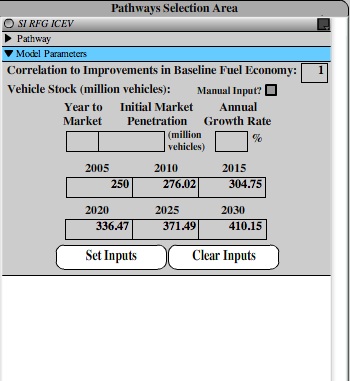 To continue the Tutorial for the Pathways Selection Area, we'll add another pathway, this one representing diesel vehicles. First, to save room, let's collapse, or shrink, the baseline pathway. Both the "Pathway" inputs area and the "Model Parameters" inputs area for each pathway is collapsible to save space. Click the blue title bar for the "Pathway" input area to shrink the baseline pathway and open up some more space. Notice that the title bar changes color to a gray color and the direction of the small black arrow changes to indicate that this area is collapsed. We'll leave the "Model Parameters" area expanded for now. |
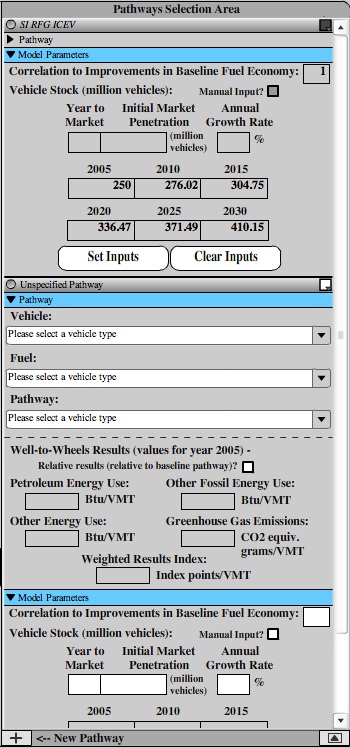 A new unspecified pathway will appear below the baseline pathway. Notice that not all of the pathway is visible and a scroll bar has now appeared on the right hand side of the Pathway Selection Area. You can use this scroll bar to scroll up and down among pathways. We can also collapse the Scenarios Area to make more room for the pathways. To do this, click the button in the lower right hand corner of the Pathway Selection Area (the one to the right of the "New Pathway" button we used above. The Scenarios Area should now collapse and the button should change to indicate that you have collapsed the area. To expand the Scenarios Area just click this button again. We'll expand the area later in the tutorial when it's time to set up the scenarios. The Pathways Selection Area should now look like the image at right. |
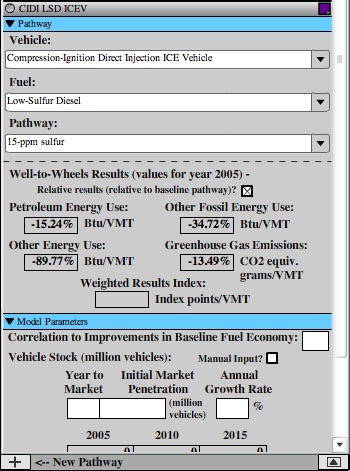
You will notice that the title for this pathway has changed to "CIDI LSD ICEV," an abbreviation for the compression-ignition direct-injection vehicle running on low-sulfur diesel fuel you just selected. Notice that this abbreviation is not displayed in italics. As mentioned above, only the baseline pathway's abbreviation is displayed in italics, to signify that it is the baseline pathway. Then, from the color selector, pick a purple color (the first color in the second-to-last column) to signify this pathway. Finally, click the "Relative results" check box to display the Well-to-Wheels results for the diesel pathway as percentage changes from the baseline pathway's results. For example, the diesel pathway uses 15.24% less petroleum energy than the baseline pathway. After completing these steps, the diesel pathway should look like the image above right. |
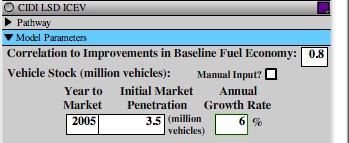
For the baseline pathway, the input areas in the "Model Parameters" area of the pathway were automatically filled in. For all other pathways, however, including this new diesel pathway, we'll have to set these inputs ourselves. To set the "Model Parameters" inputs, begin by collapsing the "Pathway" inputs are for the diesel pathway by clicking on the blue "Pathway" title bar. Then follow these steps: 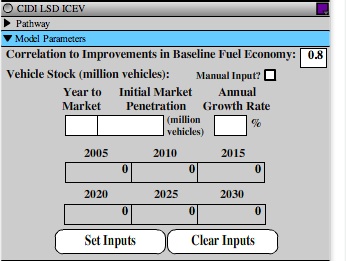 Because different pathways correspond to different vehicle technologies, improvements in fuel economy for the baseline pathway may not translate into equal improvements in fuel economy or efficiency for other pathways. For example, utilizing advanced, light-weight, composite materials in vehicle construction could improve the fuel economy of both spark-ignition gasoline vehicles as well as diesel vehicles or battery-electric vehicles. However, improvements in the engine efficiency of a spark-ignition vehicle may not come at the same time as improvements to the engine efficiency of compression-ignition vehicles or electric vehicle drivetrains. The "Correlation to Improvements in Baseline Fuel Economy" input box allows you to model these relationships using a simple input value. If the correlation input is set to "1" for a given pathway, every one mile-per-gallon improvement in fuel economy for the baseline pathway over the model's time horizon (2005-2030) will correspond to a one mile-per-gallon improvement in fuel economy or efficiency for that pathway as well. Correlation values higher than "1" mean that the fuel economy of the pathway will improve faster than the baseline pathway while values less than "1" mean that the fuel economy of the pathway will improve at a slower rate than the baseline pathway. For example, diesel compression-ignition engines are already more efficient than spark-ignition gasoline engines. Therefore, we will assume that as spark-ignition engines improve in efficiency, diesel engines will improve at a slower rate. The correlation value of "0.8" we set means that every one mpg improvement in baseline pathway fuel economy will correspond to only an 0.8 mpg improvement in fuel economy for our diesel pathway. |
|
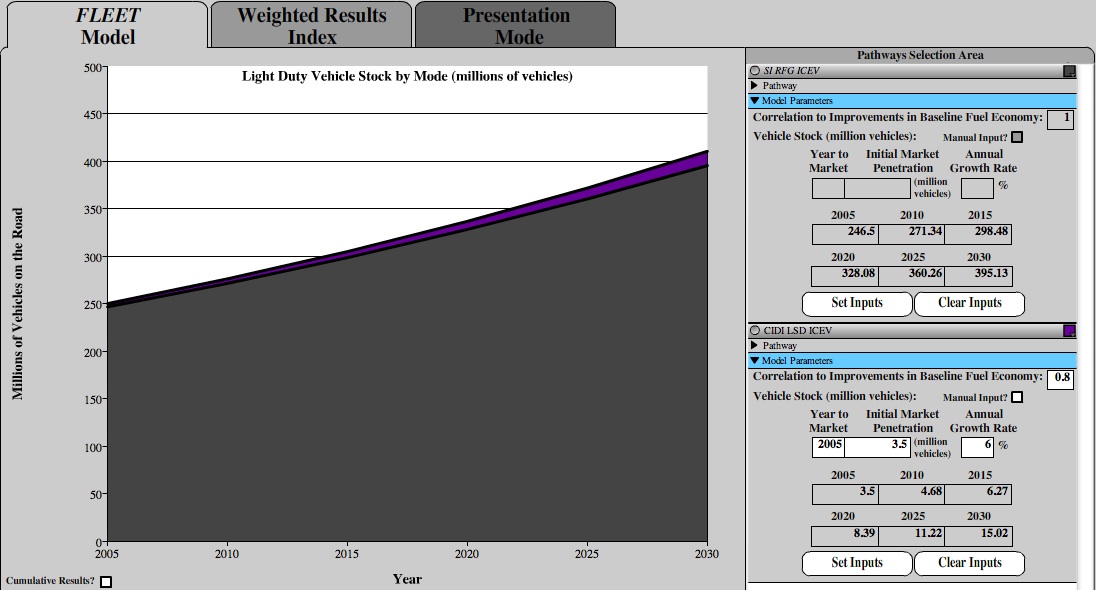
3. Finally, click the "Set Inputs" button to let FLEET know you're finished setting the inputs for this pathway and it needs to update model calculations. You will notice that three things happen when you click the "Set Inputs" button and FLEET updates the model: 1) The "Vehicle Stock" values for the diesel pathway for the years 2005-2030 all fill in. Like the "Total Light Duty Vehicle Stock" inputs we set in the Inputs Area earlier, these values are calculated by assuming the number of diesel vehicles on the road increases exponentially using the inputs we set in Step 2. above. 2) The "Vehicle Stock" values for the baseline pathway for the years 2005-2030 decrease. As mentioned above, the baseline pathway's "Vehicle Stock" values are automatically calculated as the remainder of the total fleet vehicle stock after all of the other pathways have been set, so the baseline pathway's vehicle stock values have decreased by the number of diesel pathway vehicles on the road in each year. 3) Finally, the Graph/Table Area has updated to display a purple 'wedge' representing the number of diesel pathway vehicles on the road in each year.
|
|
|
